Web Usage Summary
The reports interface allows you to create, edit, and manage reports. Reports provide a deep level of visibility in order to generate reports that satisfy various regulatory standards, and helps you determine how to best steer traffic to protect your organization.
You can use predefined parameters to create reports, or create custom queries to collect specific data about your web usage. A variety of charts can be added to a single report. You can also use one of the options on the filter dropdown list to minimize the reports shown.
This section describes the primary components in the Web Usage Summary report interface.
Web Usage Summary Reports
To open the Web Usage Summary report, click Reports in the Netskope tenant UI then select Web Usage Summary in the Reports panel.
 |
This page provides information about:
Top users with most usage
Top visited categories with web content
Top devices
Top browsers
Top blocked users
Top blocked sites.
To create a report, click New Report. In the New Report dialog, enter a report title and click Create Report.
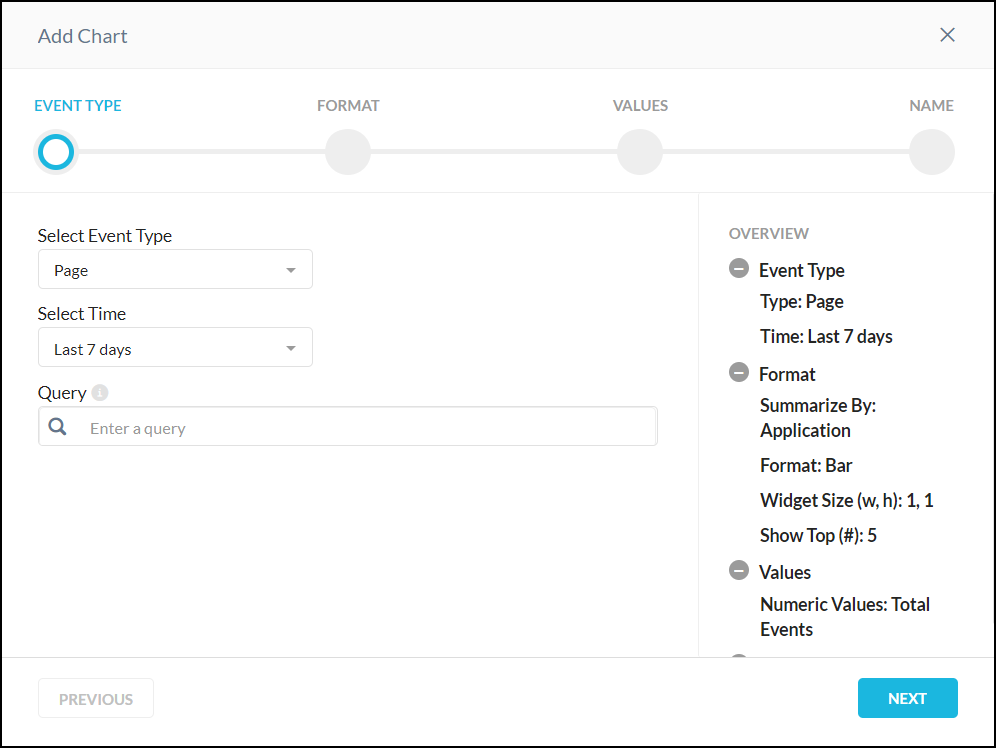
Click Add and select New Chart to open the Add Chart wizard.
 |
For Event Type, select Page. Proceed through the Add Chart wizard. When finished, click Save Chart.
 |
To create a PDF of this page, hover over the PDF button and select Download or Email. To export a CSV file, select the down arrow in the top banner of each chart and click Export CSV. The reports page only shows the top 100 records in a chart, but the exported CSV file includes all of the data collected for the options chosen.