Elastic Plugin for Log Shipper
This document explains how to configure your Elastic integration with the Log Shipper module of the Netskope Cloud Exchange platform. This integration allows pushing alerts and events from Netskope to the Elastic platform.
To complete this configuration, you need:
A Netskope tenant (or multiple, for example, production and development/test instances)
A Netskope Cloud Exchange tenant with the Log Shipper module already configured.
Your Filebeat TCP Server address and port.
Note
Verify your Elastic instance permissions are secure and not set up for open public access. Only allow access to your cloud storage instance from your Cloud Exchange Host and any other addresses that need access.
Configure Filebeat to listen on a specific port.
Configure the Elastic plugin.
Configure Log Shipper Business Rules for Elastic.
Configure Log Shipper SIEM Mappings for Elastic.
Validate the Elastic plugin.
Click play to watch a video.
Install and configure Elastic search.
(Reference: https://www.elastic.co/guide/en/elasticsearch/reference/7.15/install-elasticsearch.html)
Install and configure Kibana to view data.
(Reference: https://www.elastic.co/guide/en/kibana/7.15/install.html)
Install and configure Filebeat to listen on a specific port.
(Reference: https://www.elastic.co/guide/en/beats/filebeat/7.15/filebeat-installation-configuration.html)
Install the Netskope extension in Elastic.
(Reference: https://docs.elastic.co/integrations/netskope)
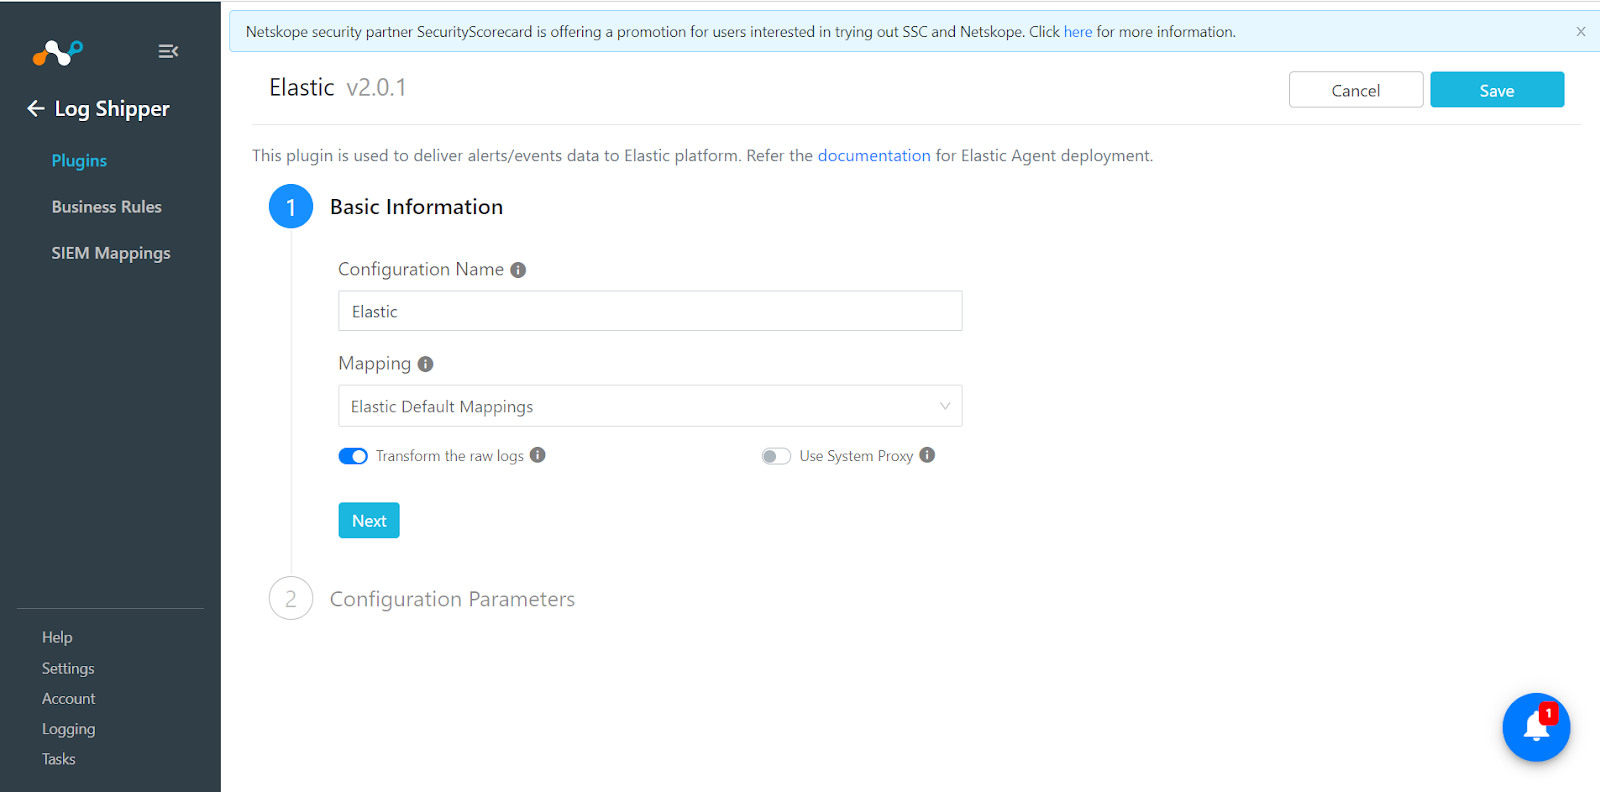
In Cloud Exchange, go to Settings > Plugins.
Search for and select the Elastic v2.0. (CLS) box to open the plugin creation pages.
Enter a Configuration Name.
Select a valid Mapping (Default Mappings for all plugins are available). If the Transform the raw logs is enabled, Raw logs will be transformed using the selected mapping file; otherwise, raw logs will be sent to SIEM. The ingestion may be affected if the SIEM does not accept the raw logs format. When finished, click Next.
Enter your Server Address and Server Port.
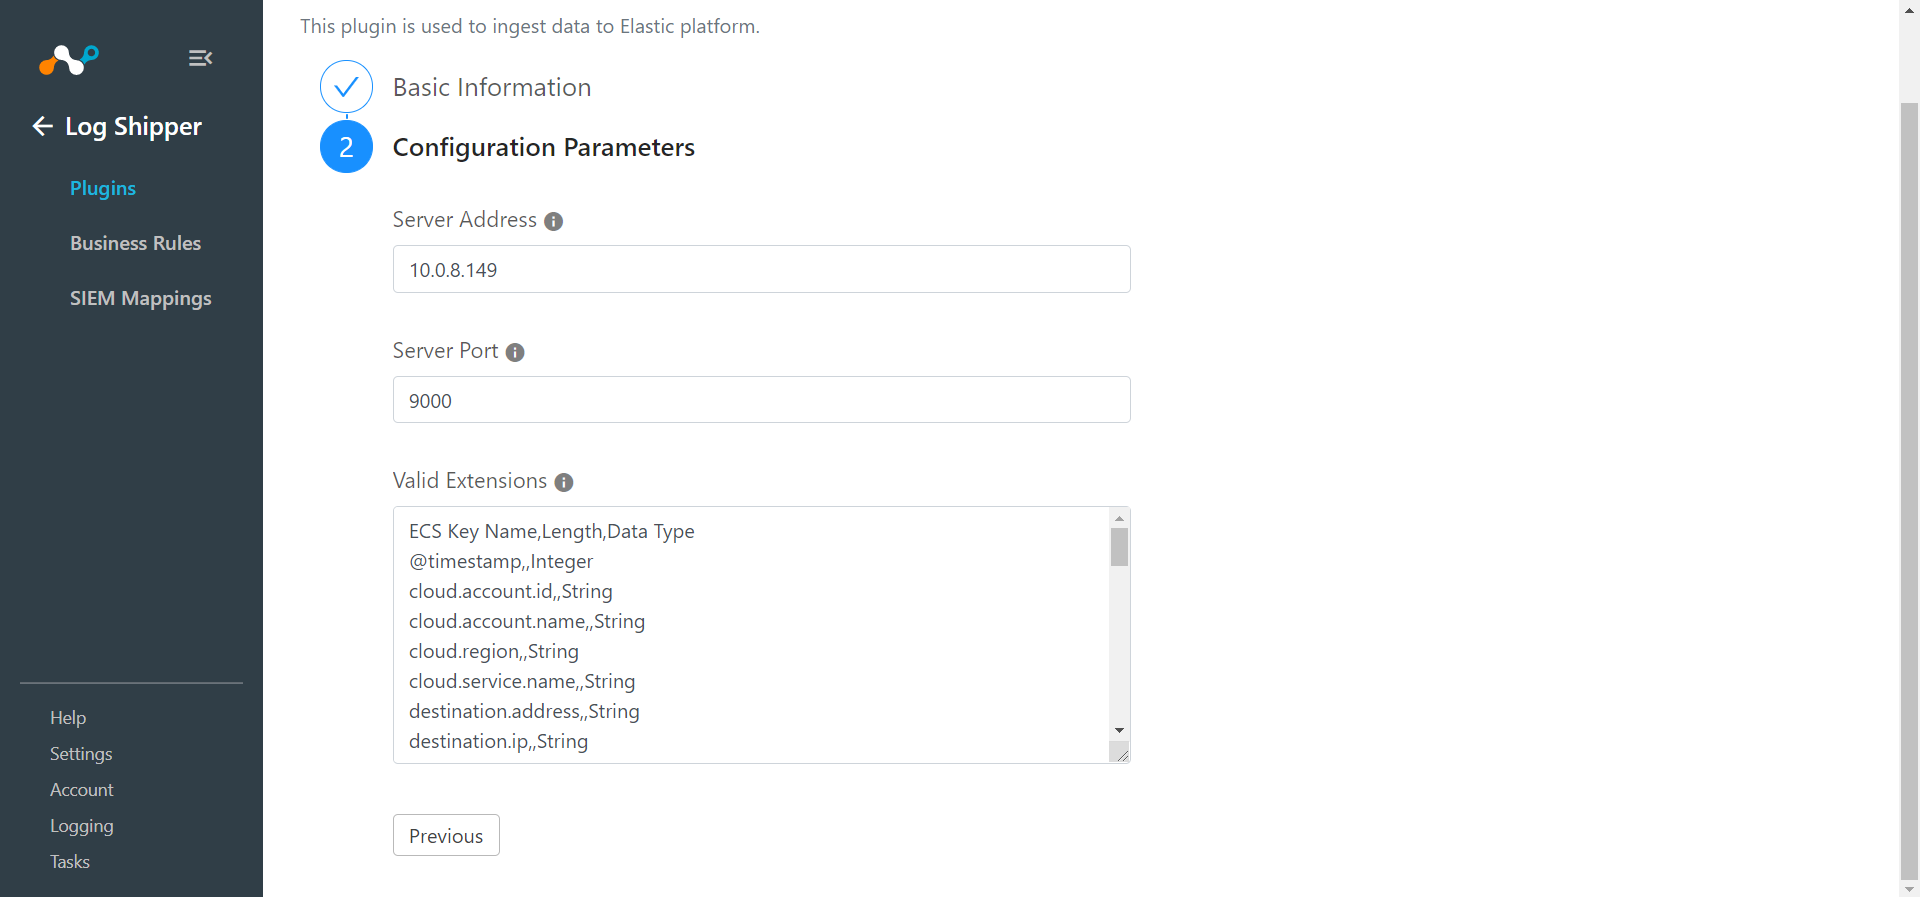
Click Save.
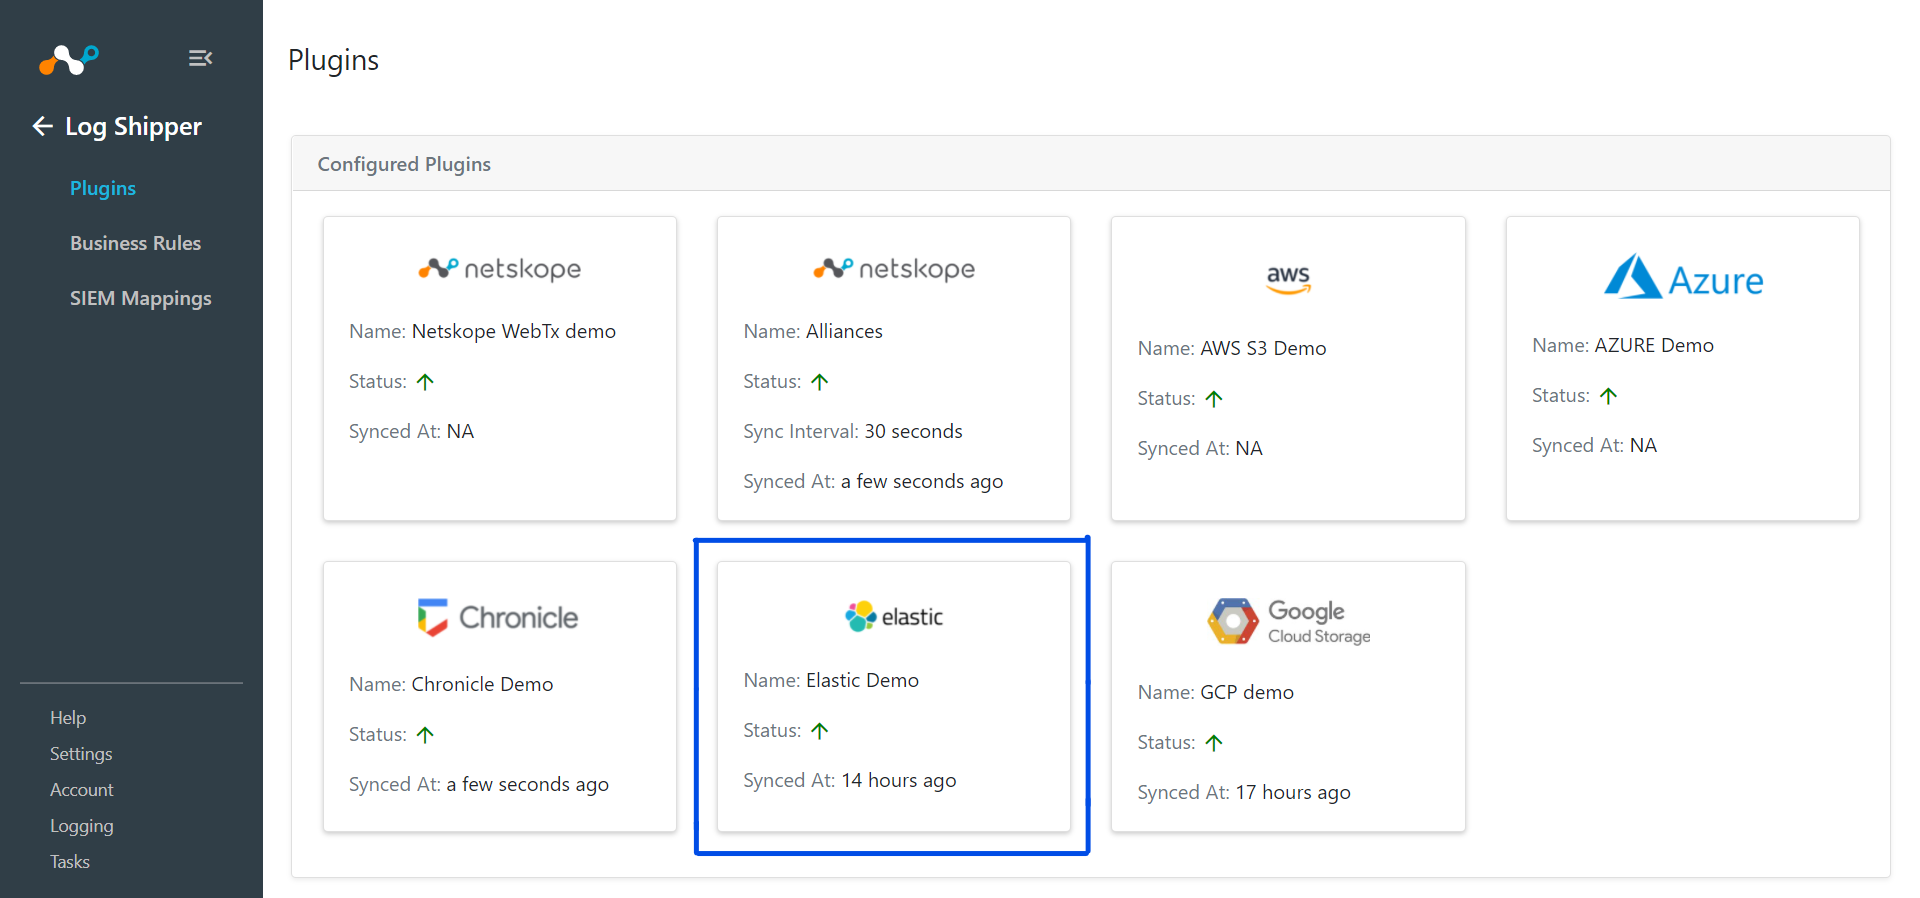
Go to Log Shipper > Business Rules.
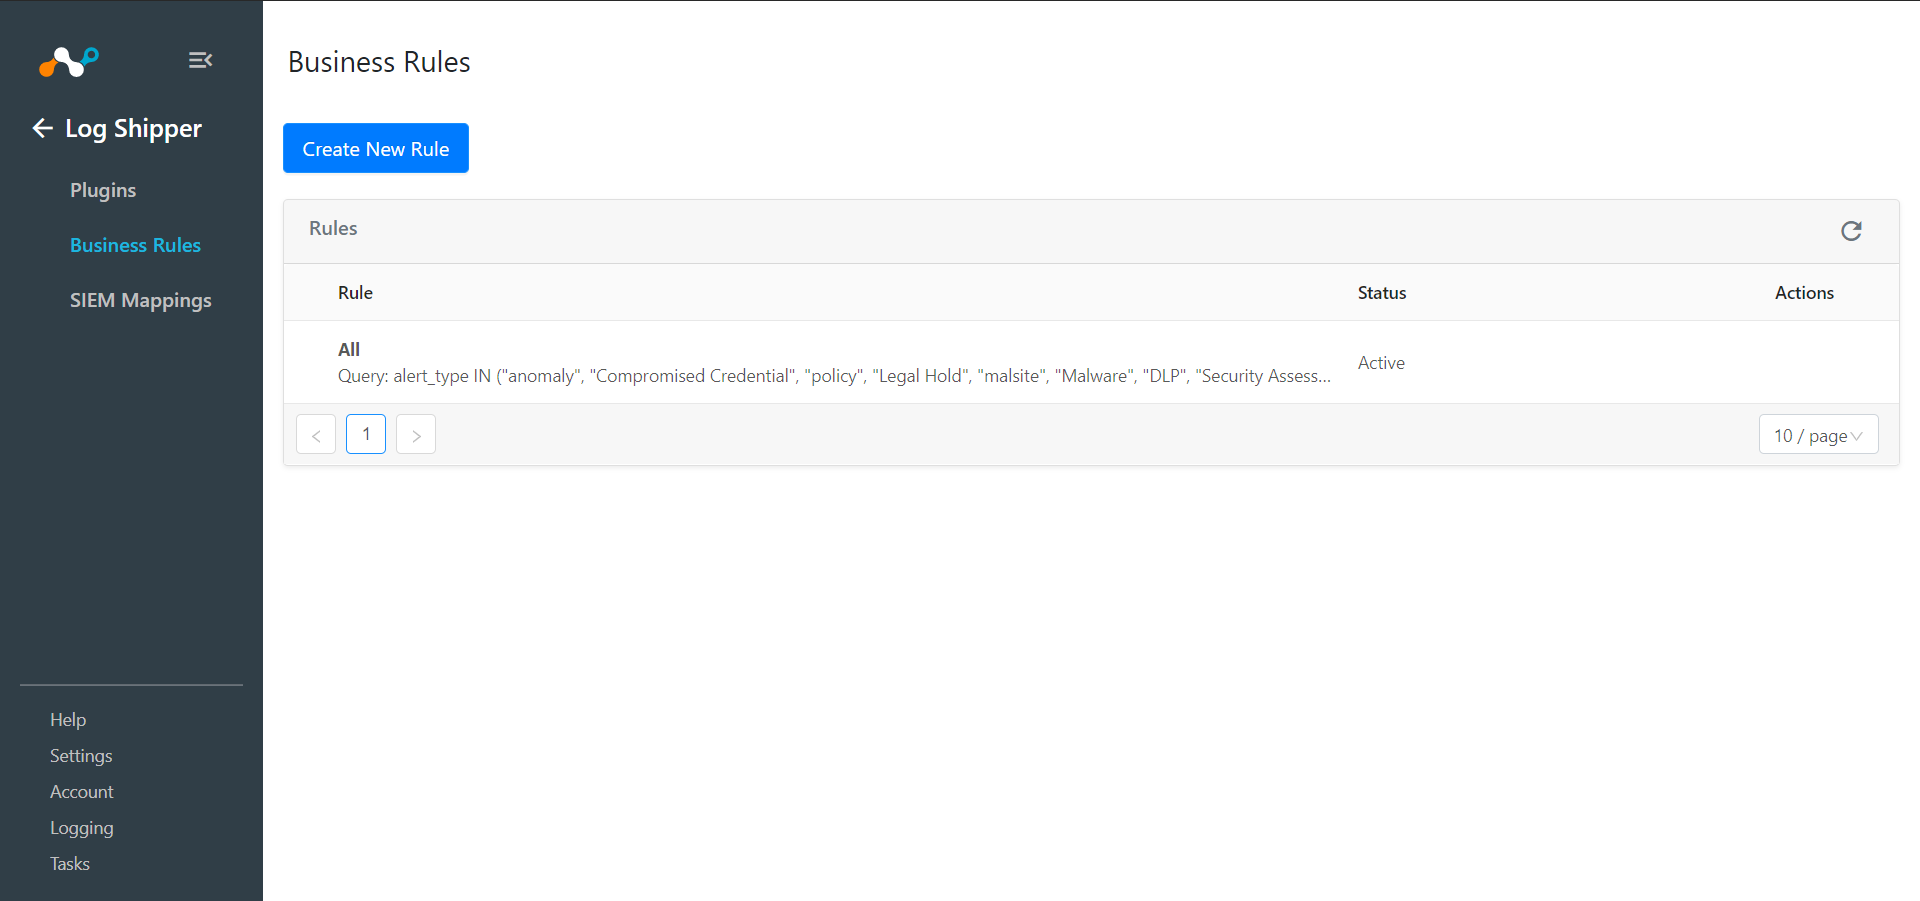
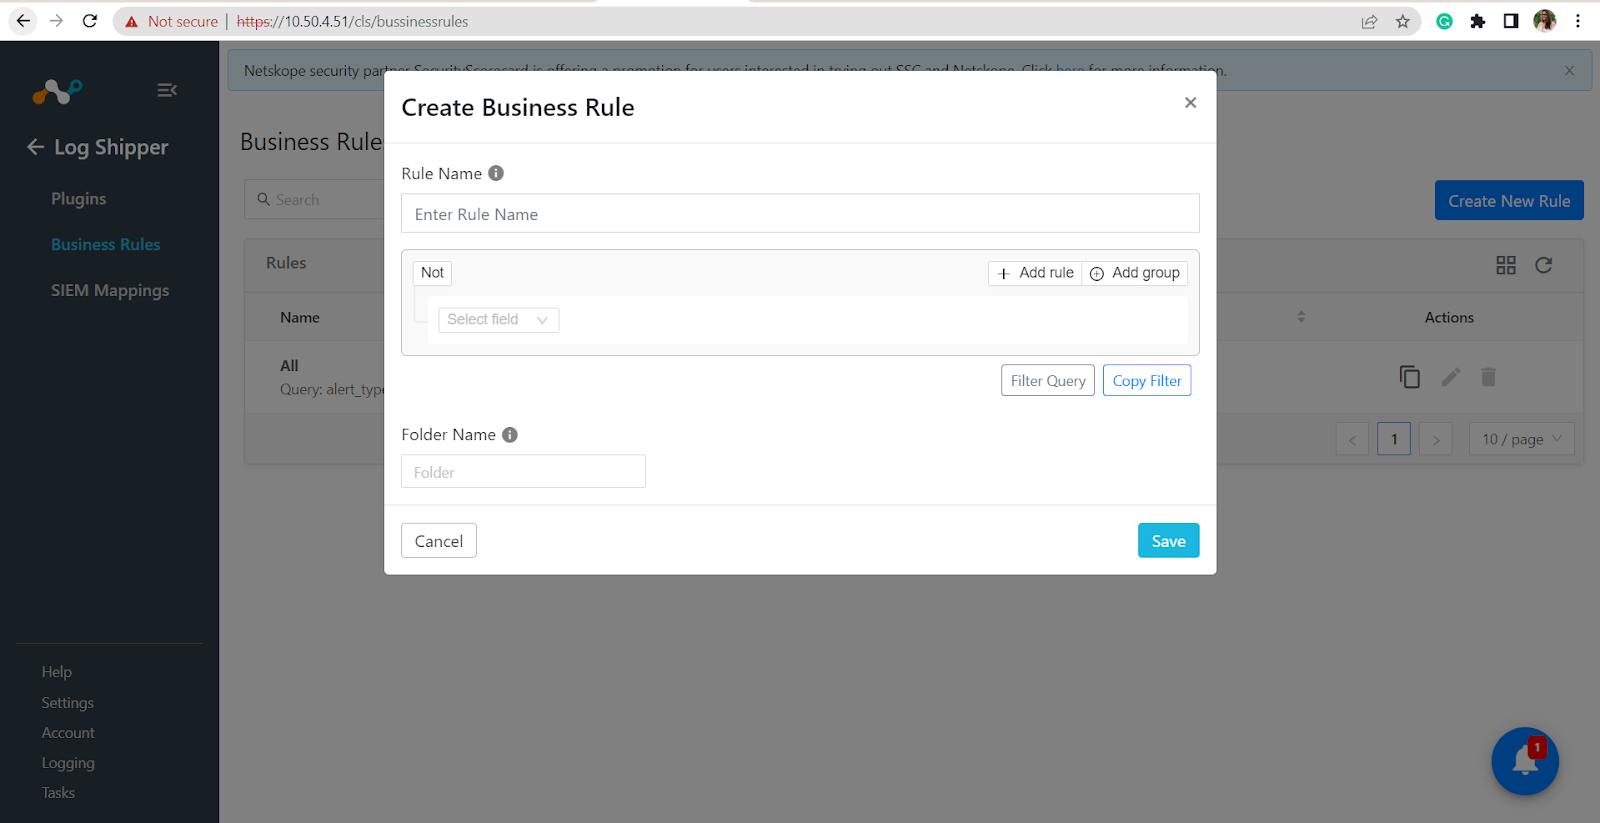
Click Create New Rule.
Tip
If you want all the events and alerts ingested into your SIEM Mapping, you can use the default ALL rule.
Enter a Rule Name and configure a query for business rules based on your requirements; and click on the save button in the bottom left corner to save the rule.
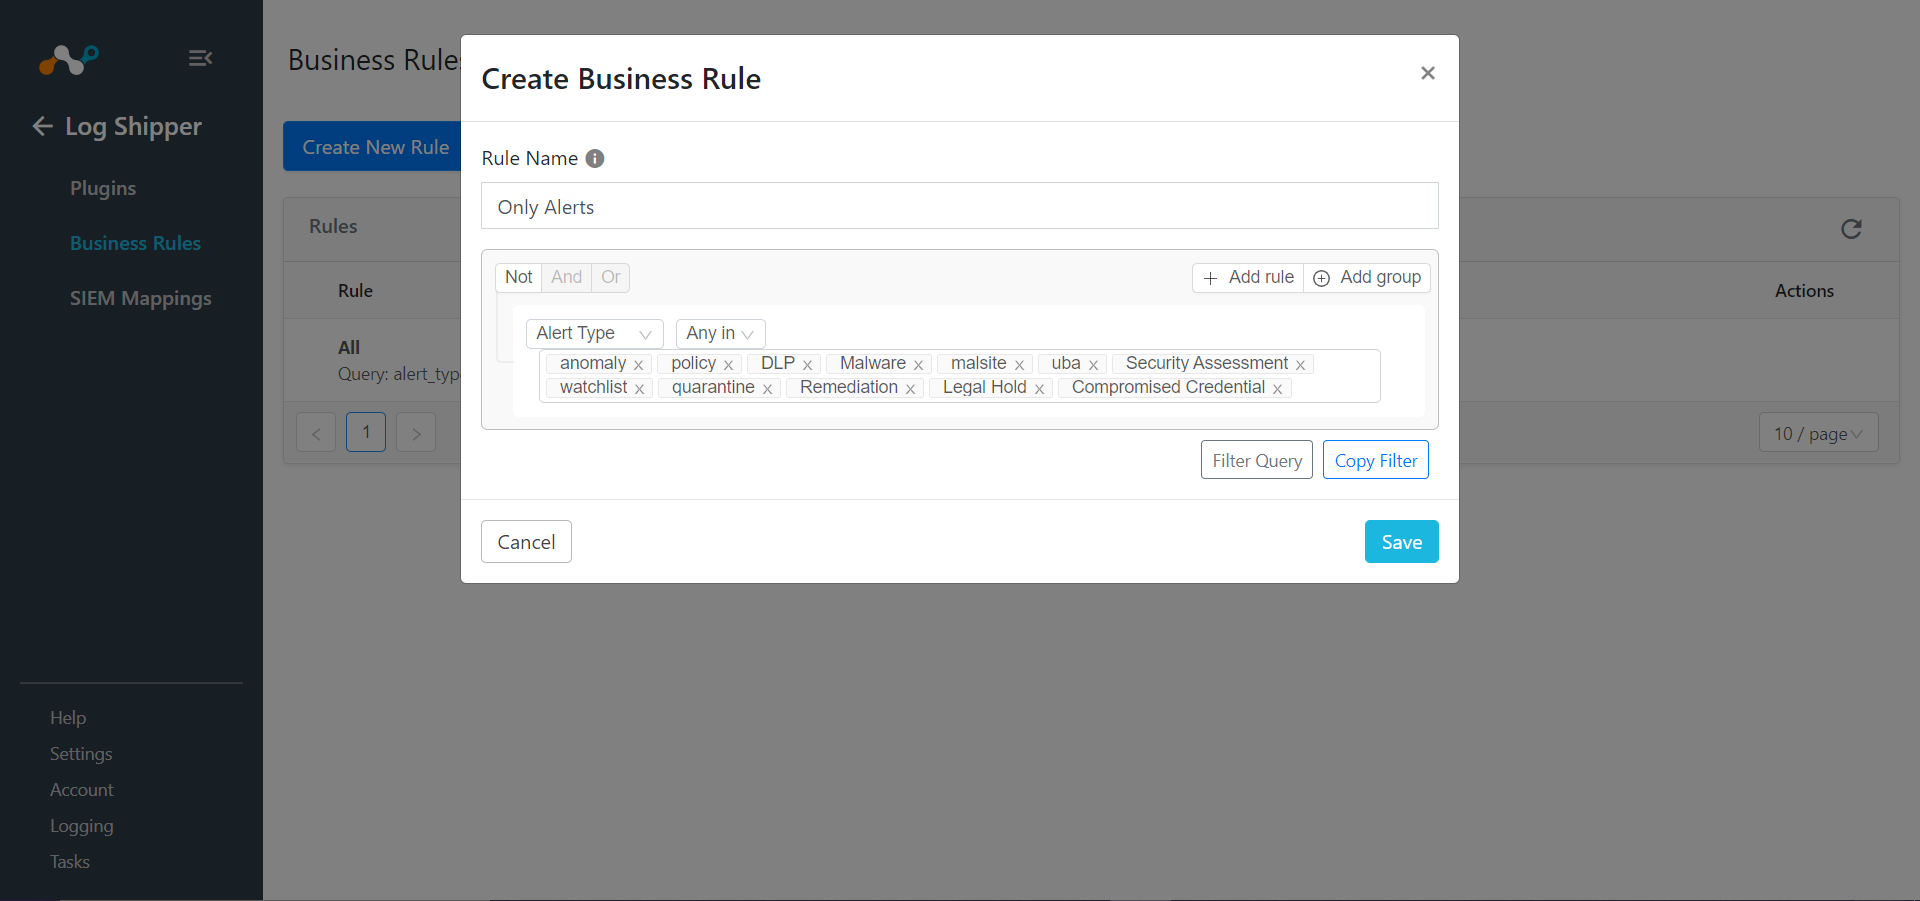
Click Save.
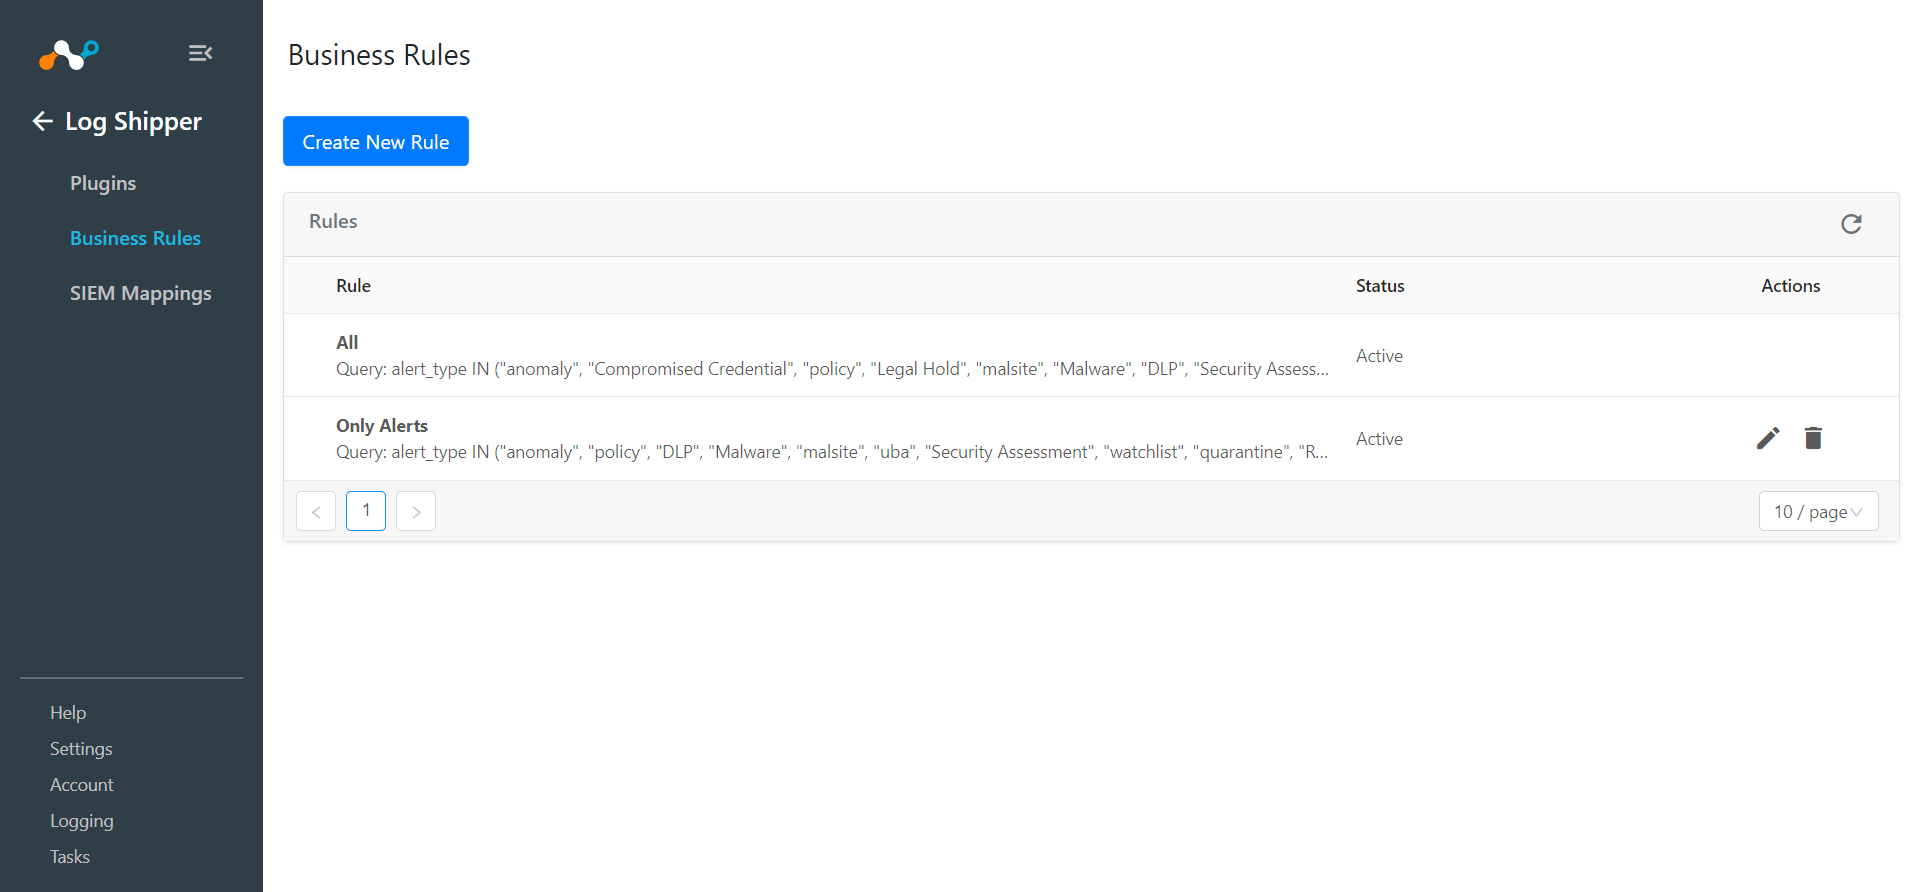
Go to Log Shipper > SIEM Mappings and click Add SIEM Mapping.
Select a Source Configuration (Netskope) Destination Configuration (Elastic), and select a business rule from the dropdown. ,
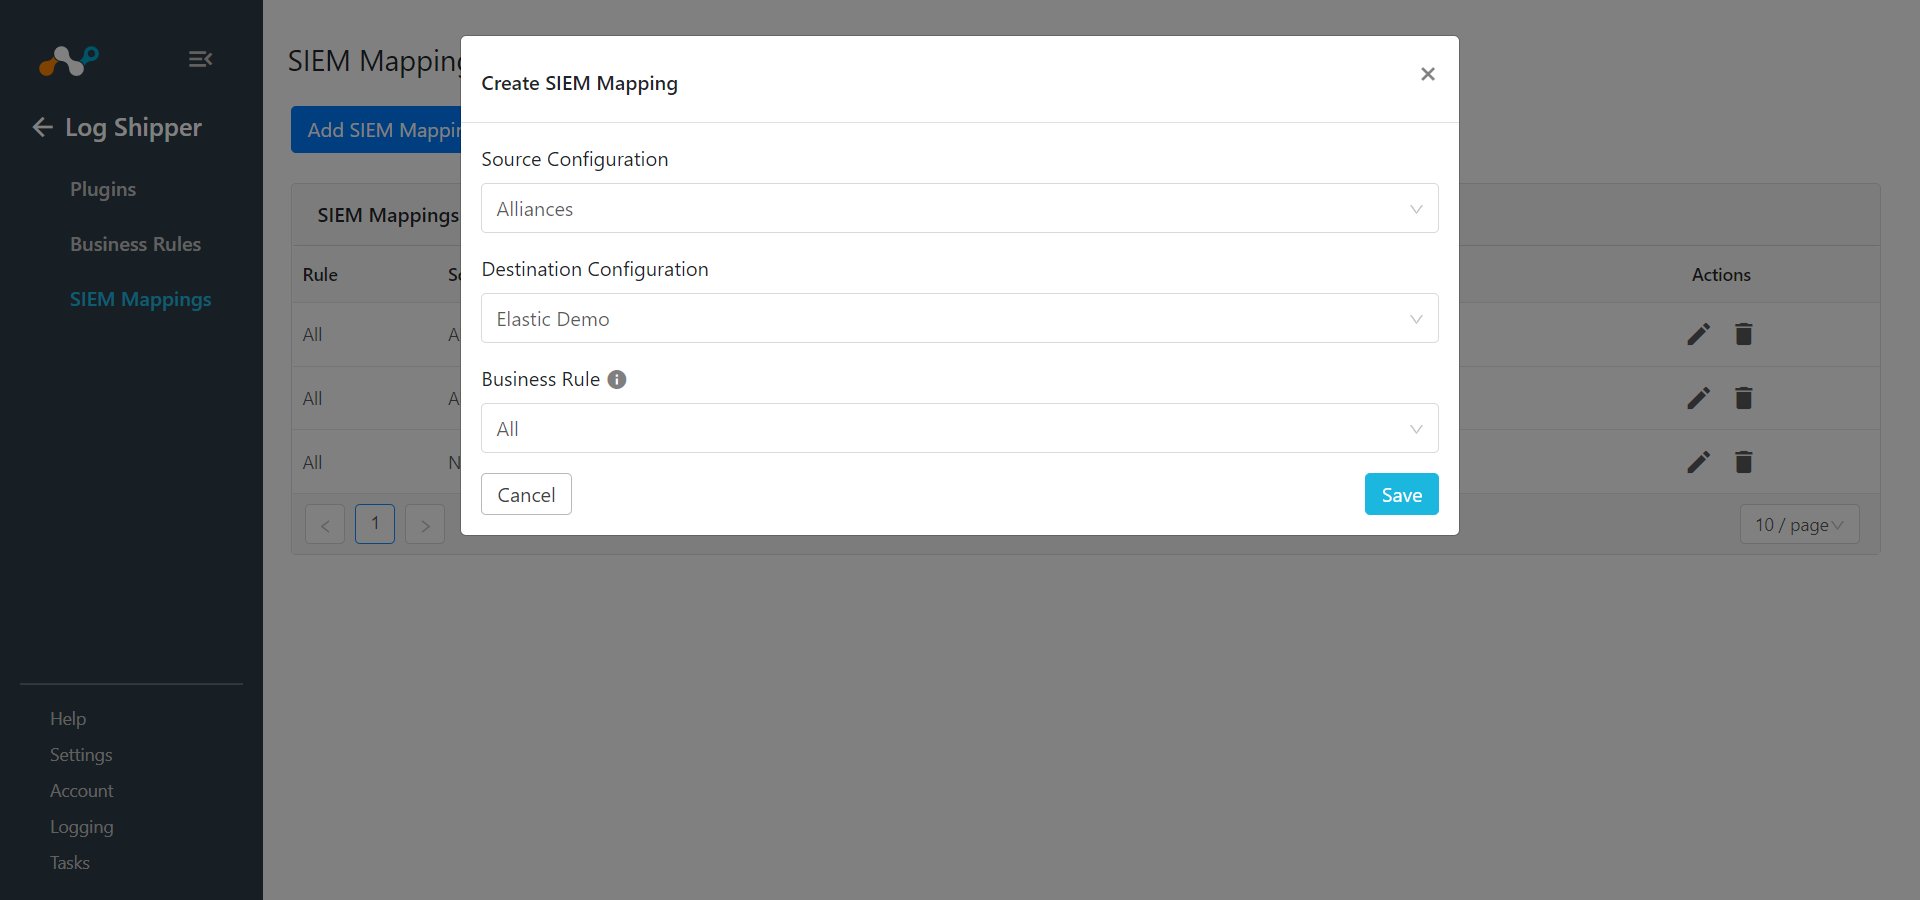
Click Save.
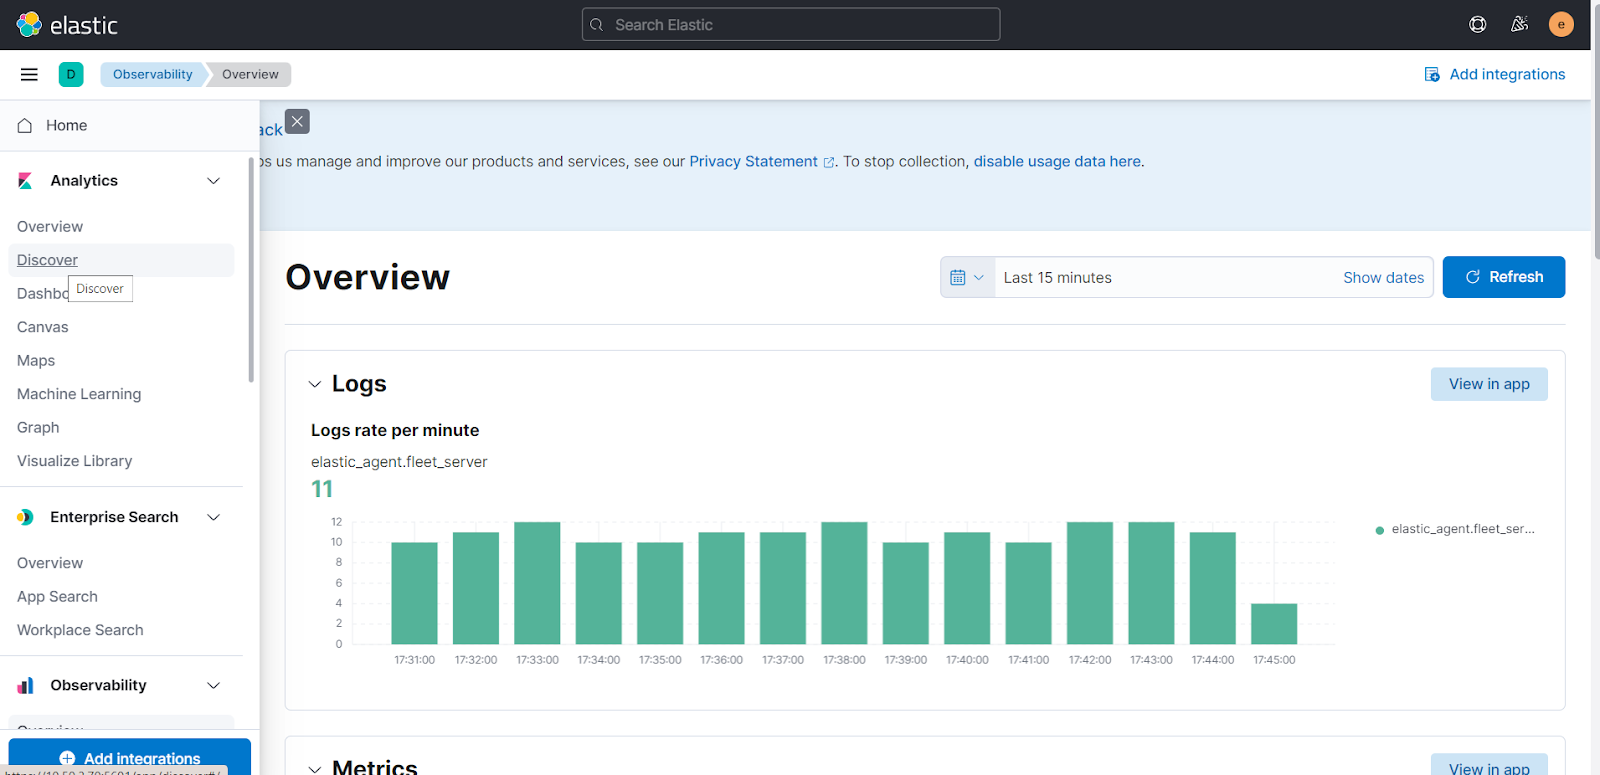
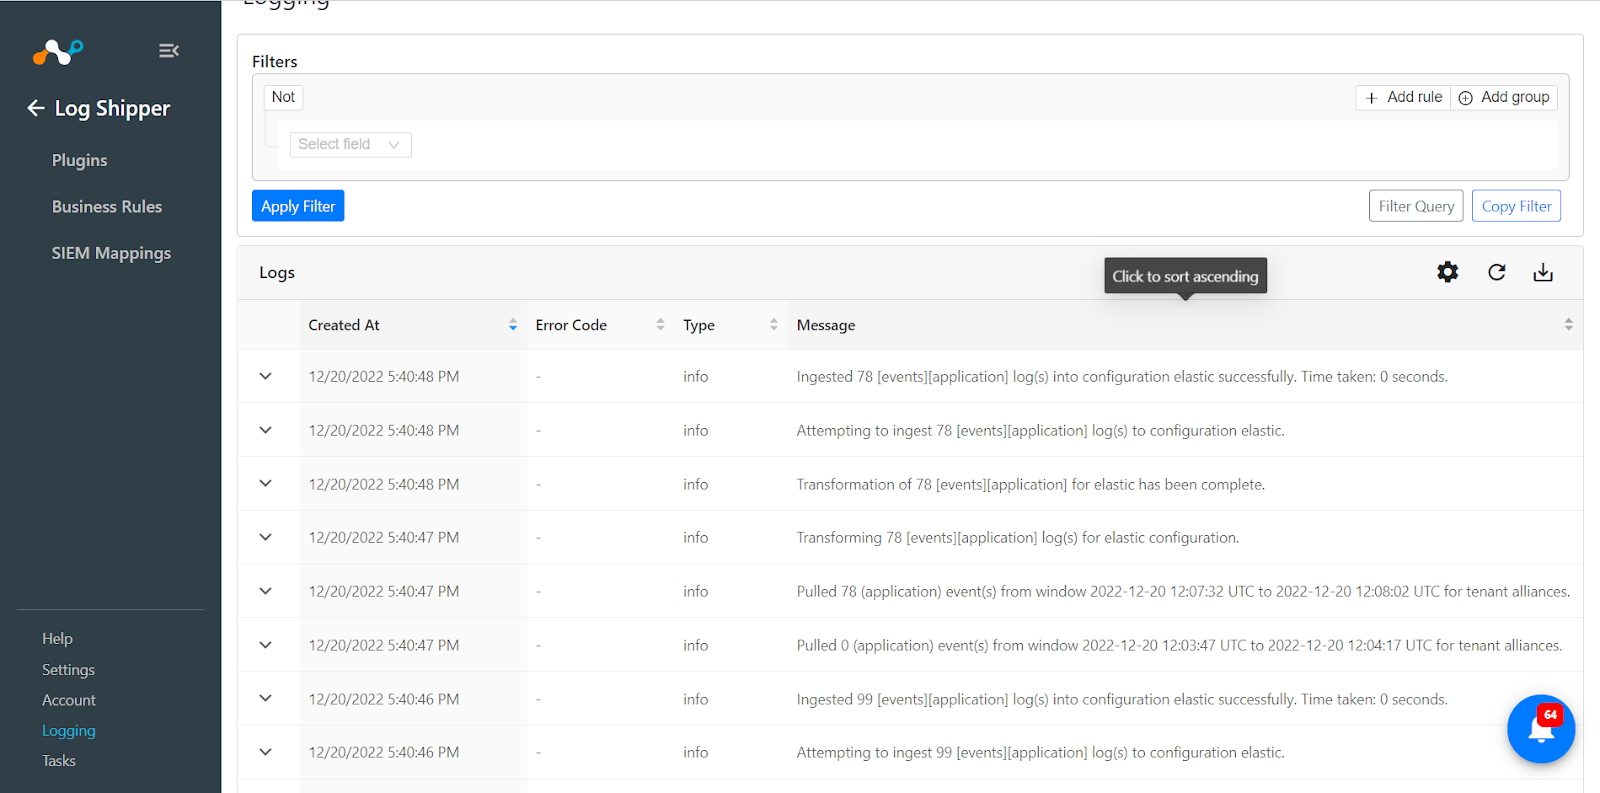
To validate the plugin workflow, you can check from Netskope Cloud Exchange and from Kibana.
To validate from Netskope Cloud Exchange, go to Logging. Search for logs with Messages containing ingested.
 |
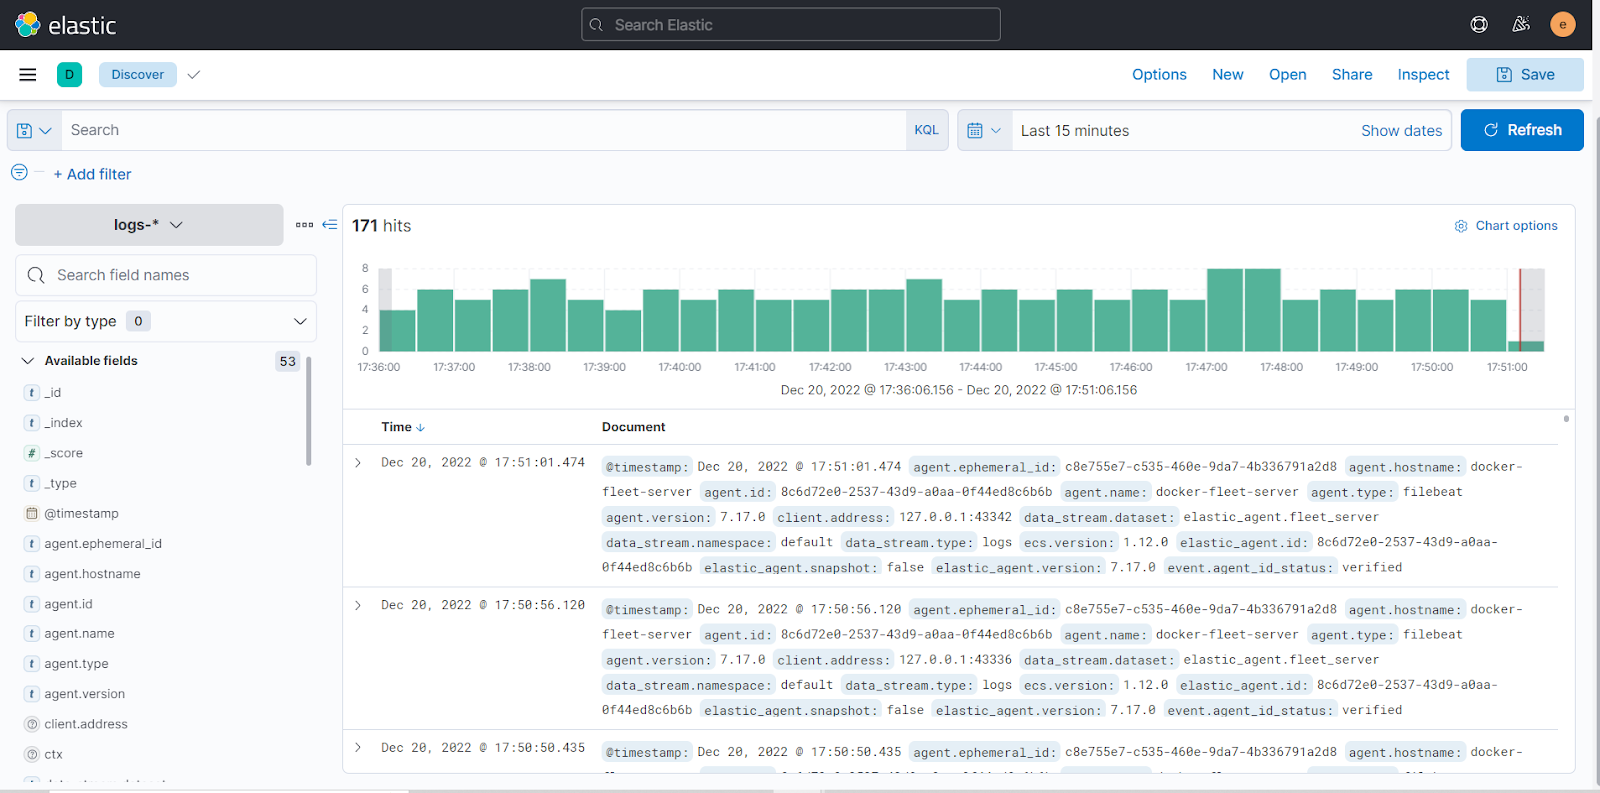
To validate from the Kibana.
Log in to your Kibana instance. In the left menu go to Discover. You will see the ingested logs.
