Investigate Netskope IoT Security
Investigate Devices
Navigate to Investigate > Devices menu to see an entire dashboard stating the device summary in your environment based on different aspects like spectrum, type, ownership, etc.
Note
You can also sort the device summary in combination with the total of all devices, managed, unmanaged, new, automated, and user-controlled devices.
Investigate Devices based on Spectrum
Navigate to Investigate > Devices menu and select the Spectrum tab from the navigation bar to see the devices based on the network spectrum in the environment.
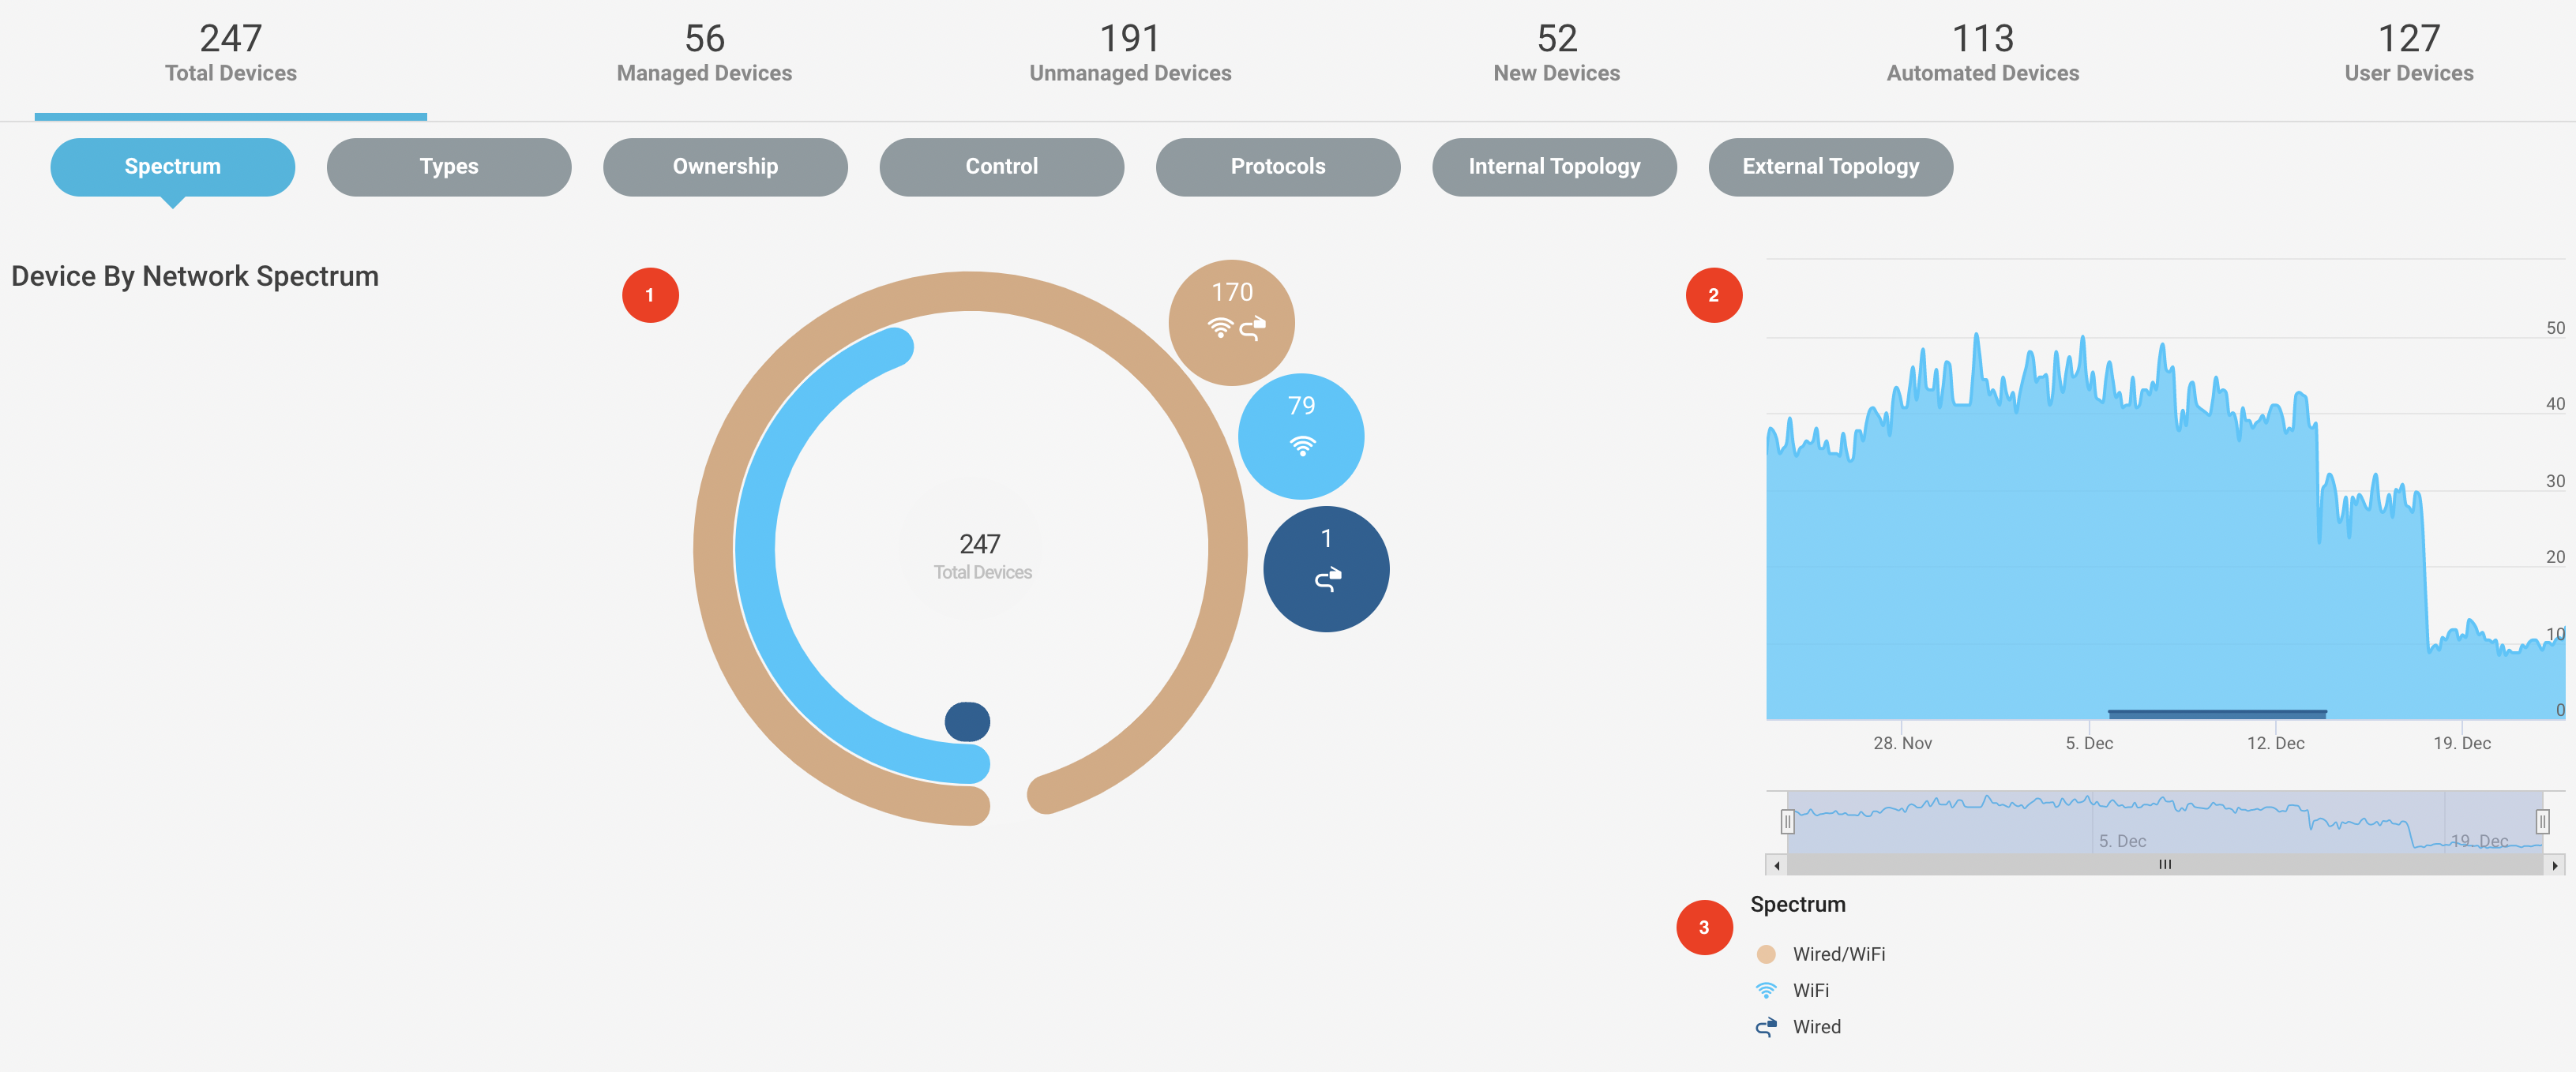 |
You will see a pie chart with the number of devices connected through Wi-FI, wired connections, or with undetermined interface information. Click on the pie chart elements to see an entire list of devices with detailed device summary.
The high chart on the right shows the analog representation of Wi-Fi and wired devices on a specific time stamp.
You can filter the chart results by toggling the elements in the spectrum class.
Investigate Devices based on Type
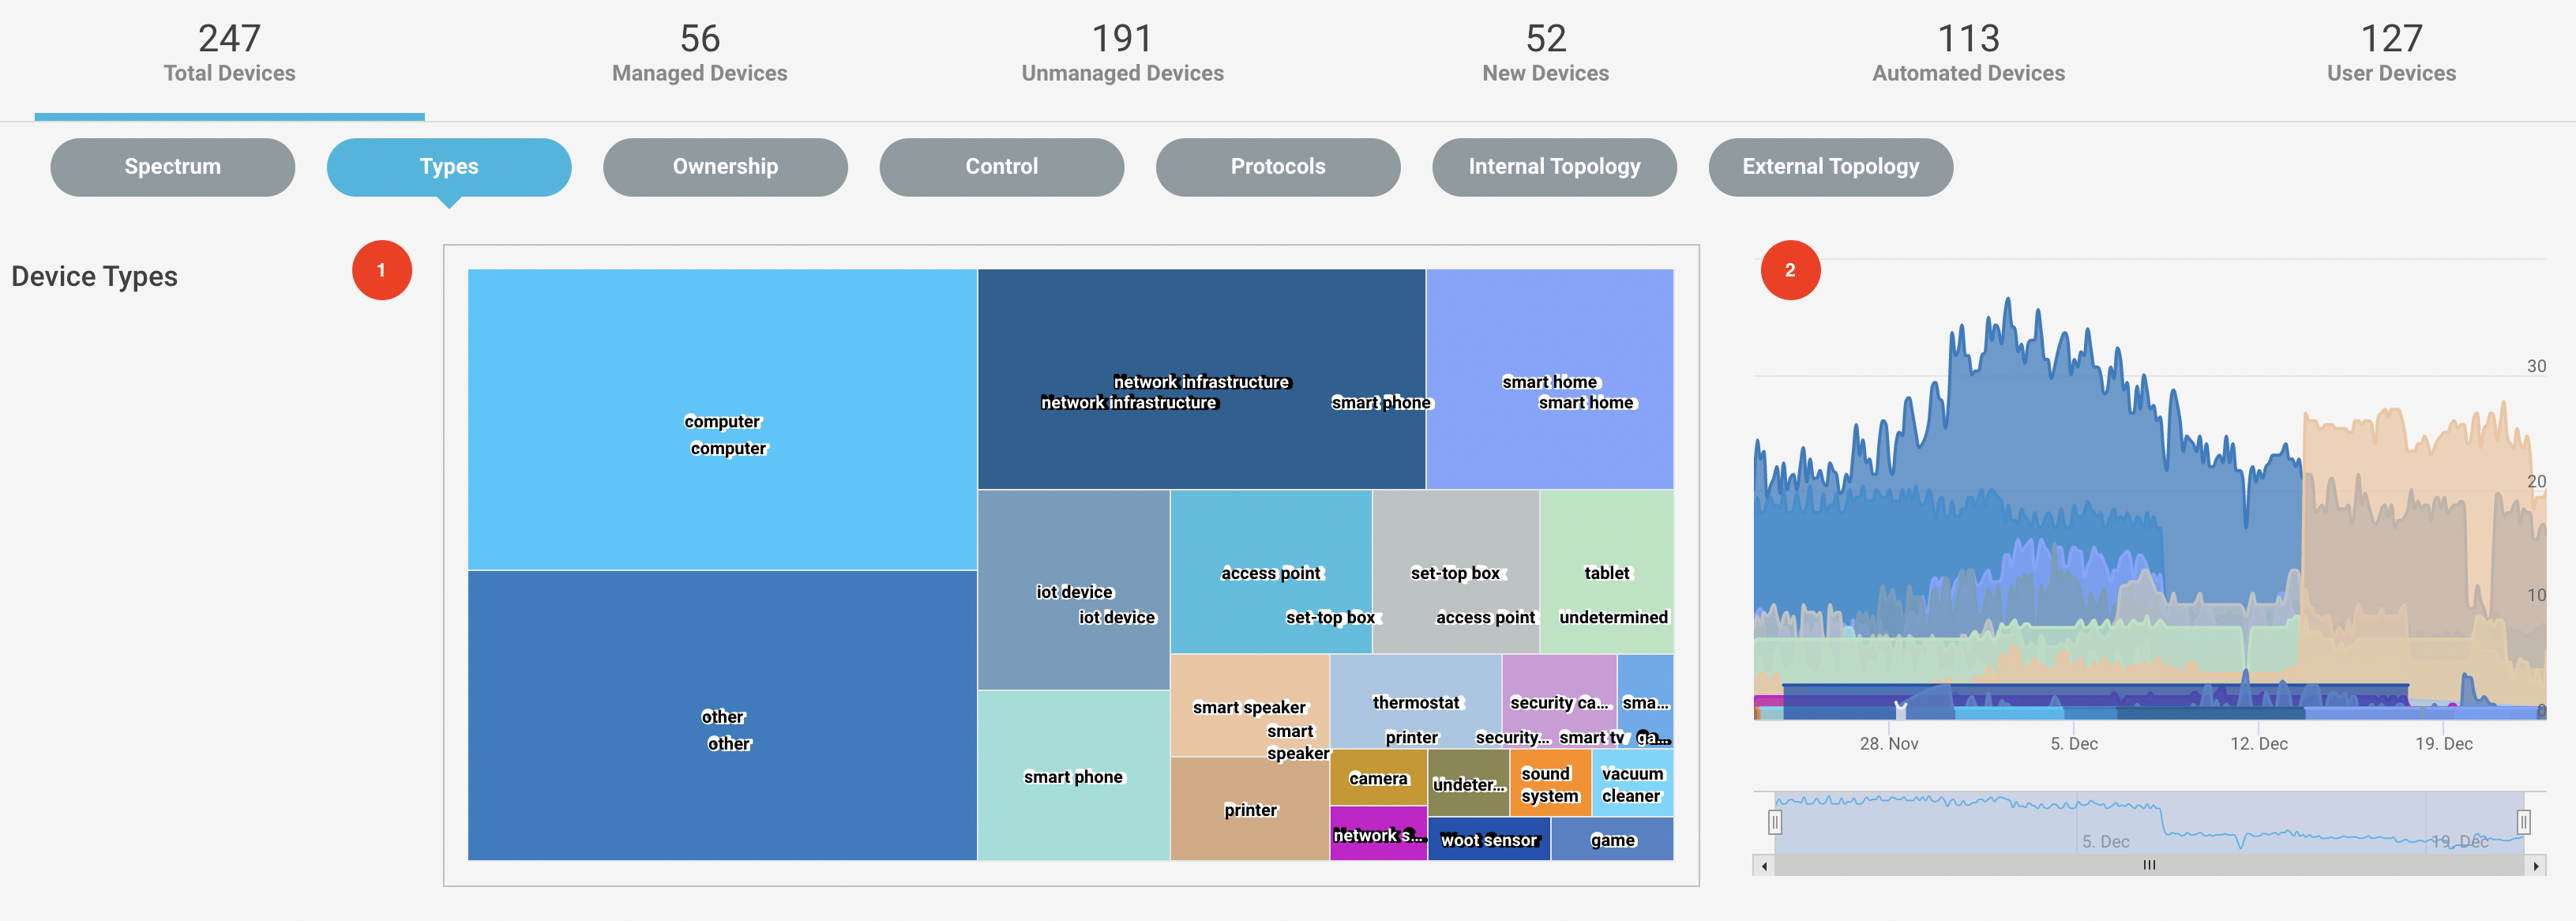
Navigate to Investigate > Devices menu and select the Type tab from the navigation bar to see the devices based on distinct types in the environment.
 |
 |
The chart shows the distinct device types connected in the environment, like computers, smart phones, IOT devices, etc. You can hover over them to see the number of devices.
The high chart on the right shows the analog representation of the devices on a specific time stamp.
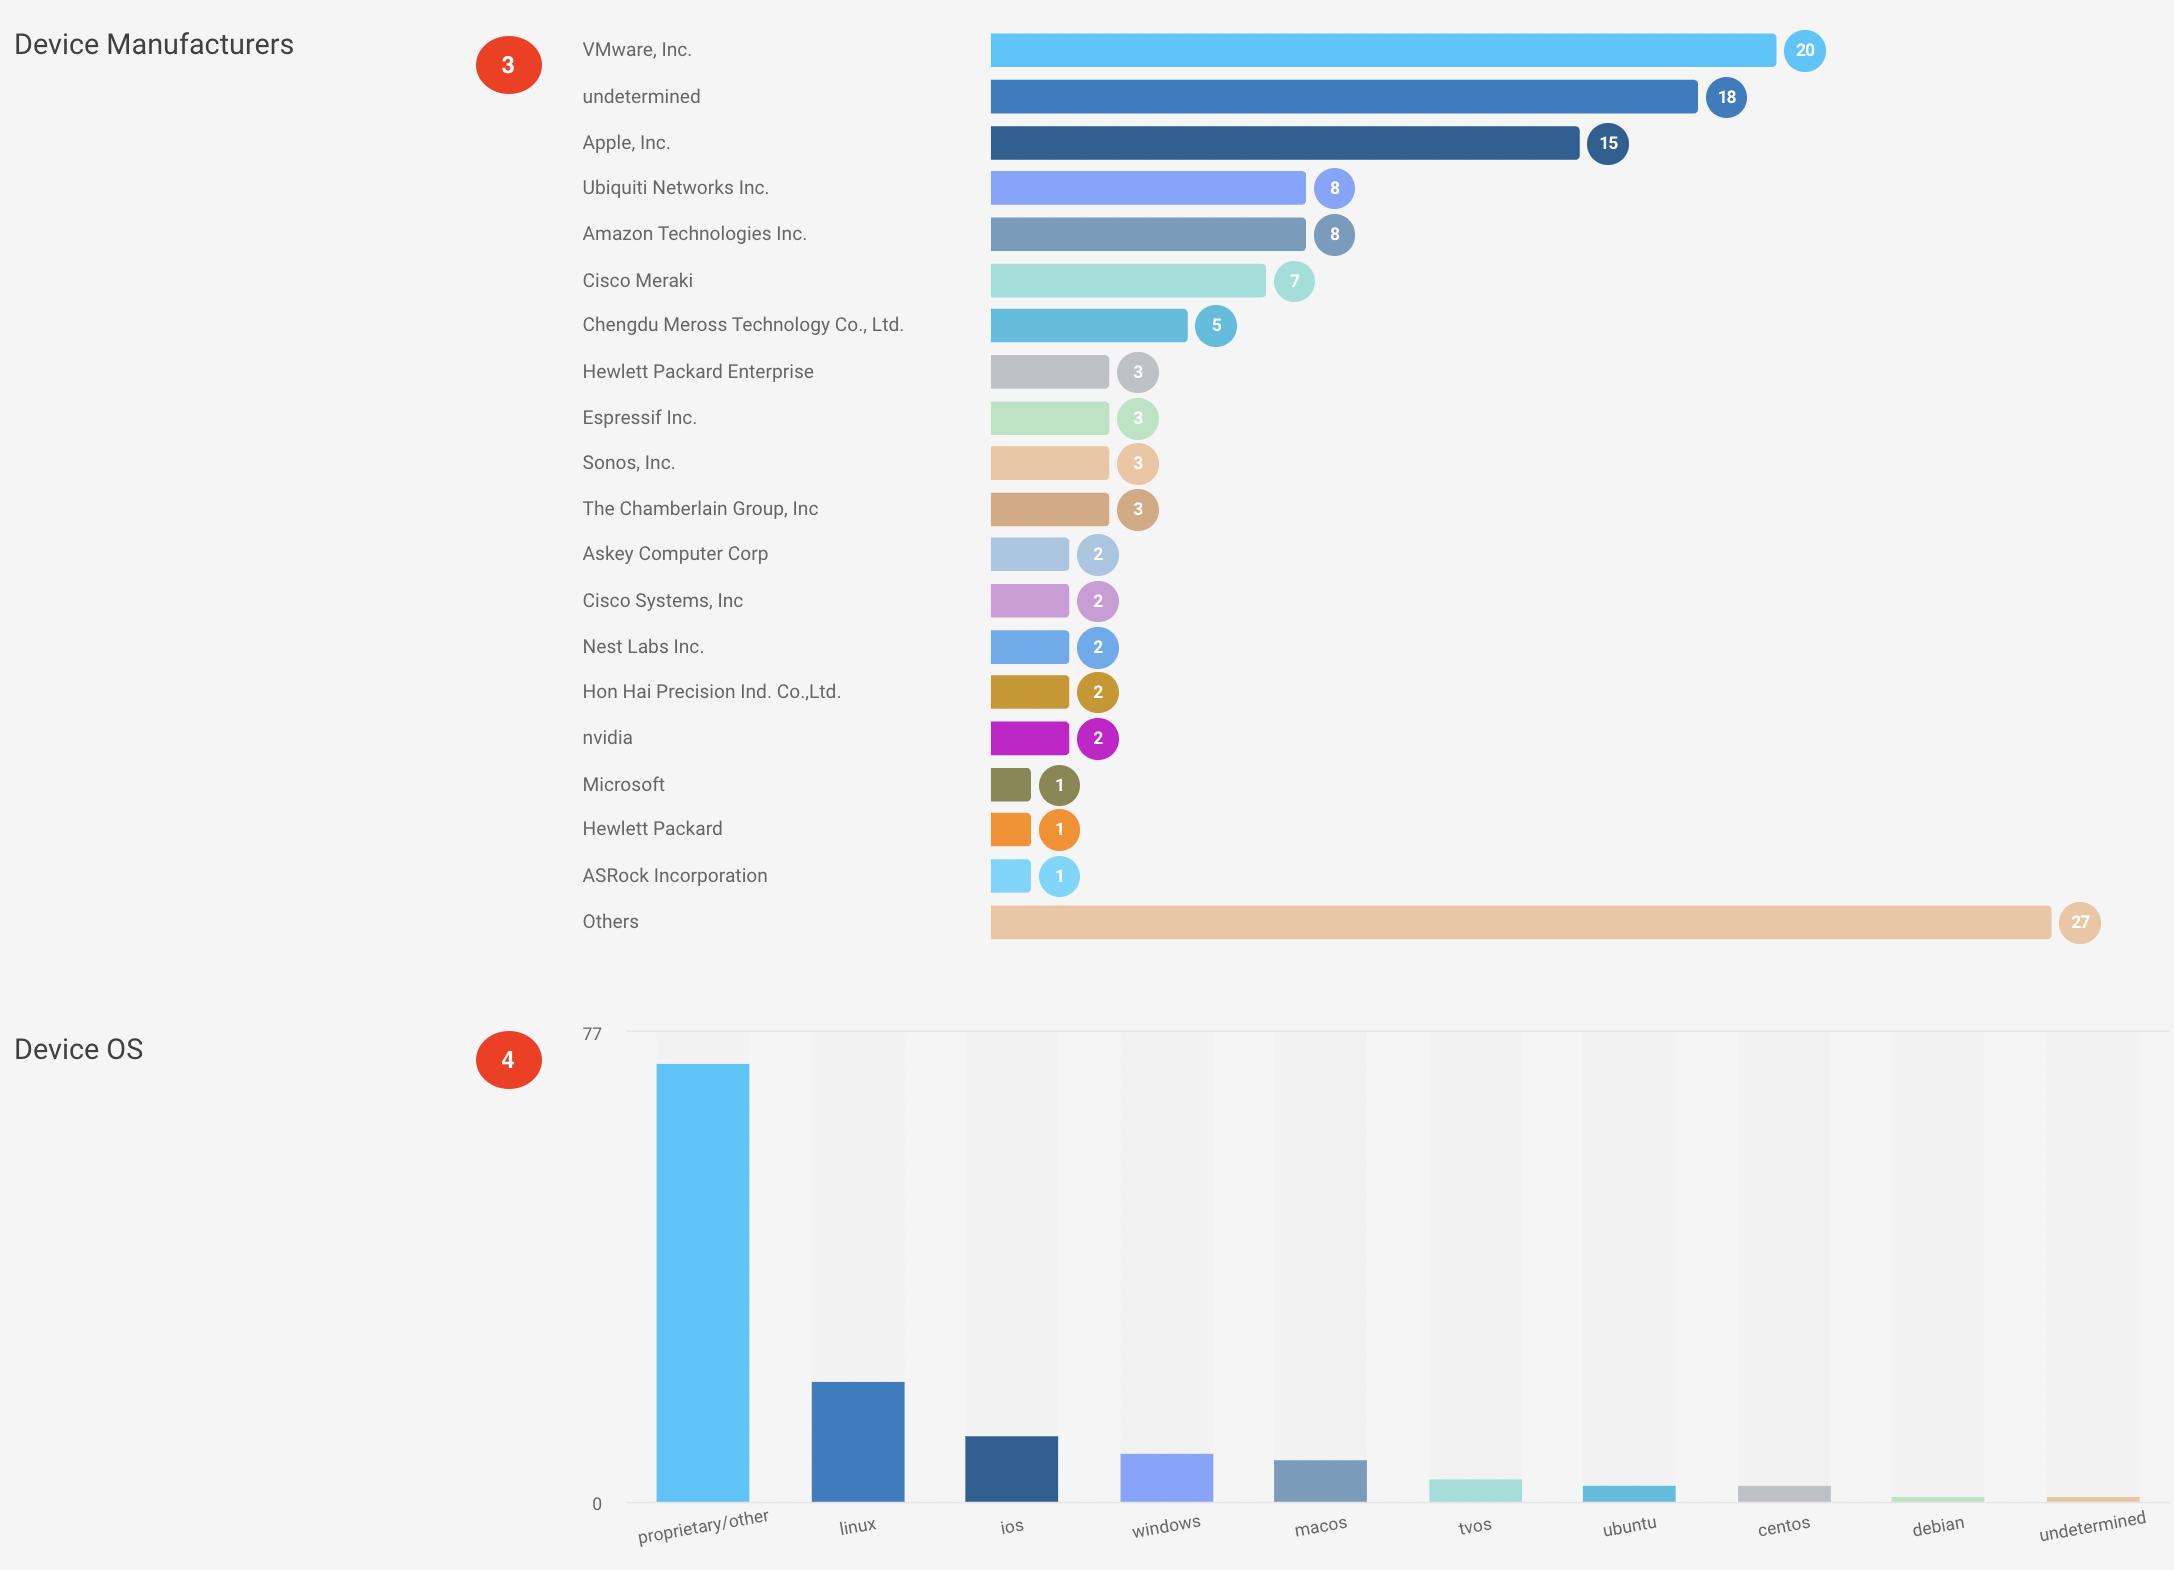
You can see a bar graph representing the manufacturers of the devices like Philips, HP, etc connected in your environment.
The bar graph shows the devices sorted by operating systems like Android, Linux, Windows, Mac, etc.
Investigate Devices based on Ownership
Navigate to Investigate > Devices menu and select the Ownership tab from the navigation bar to see the devices based on the owners of the devices in the environment.
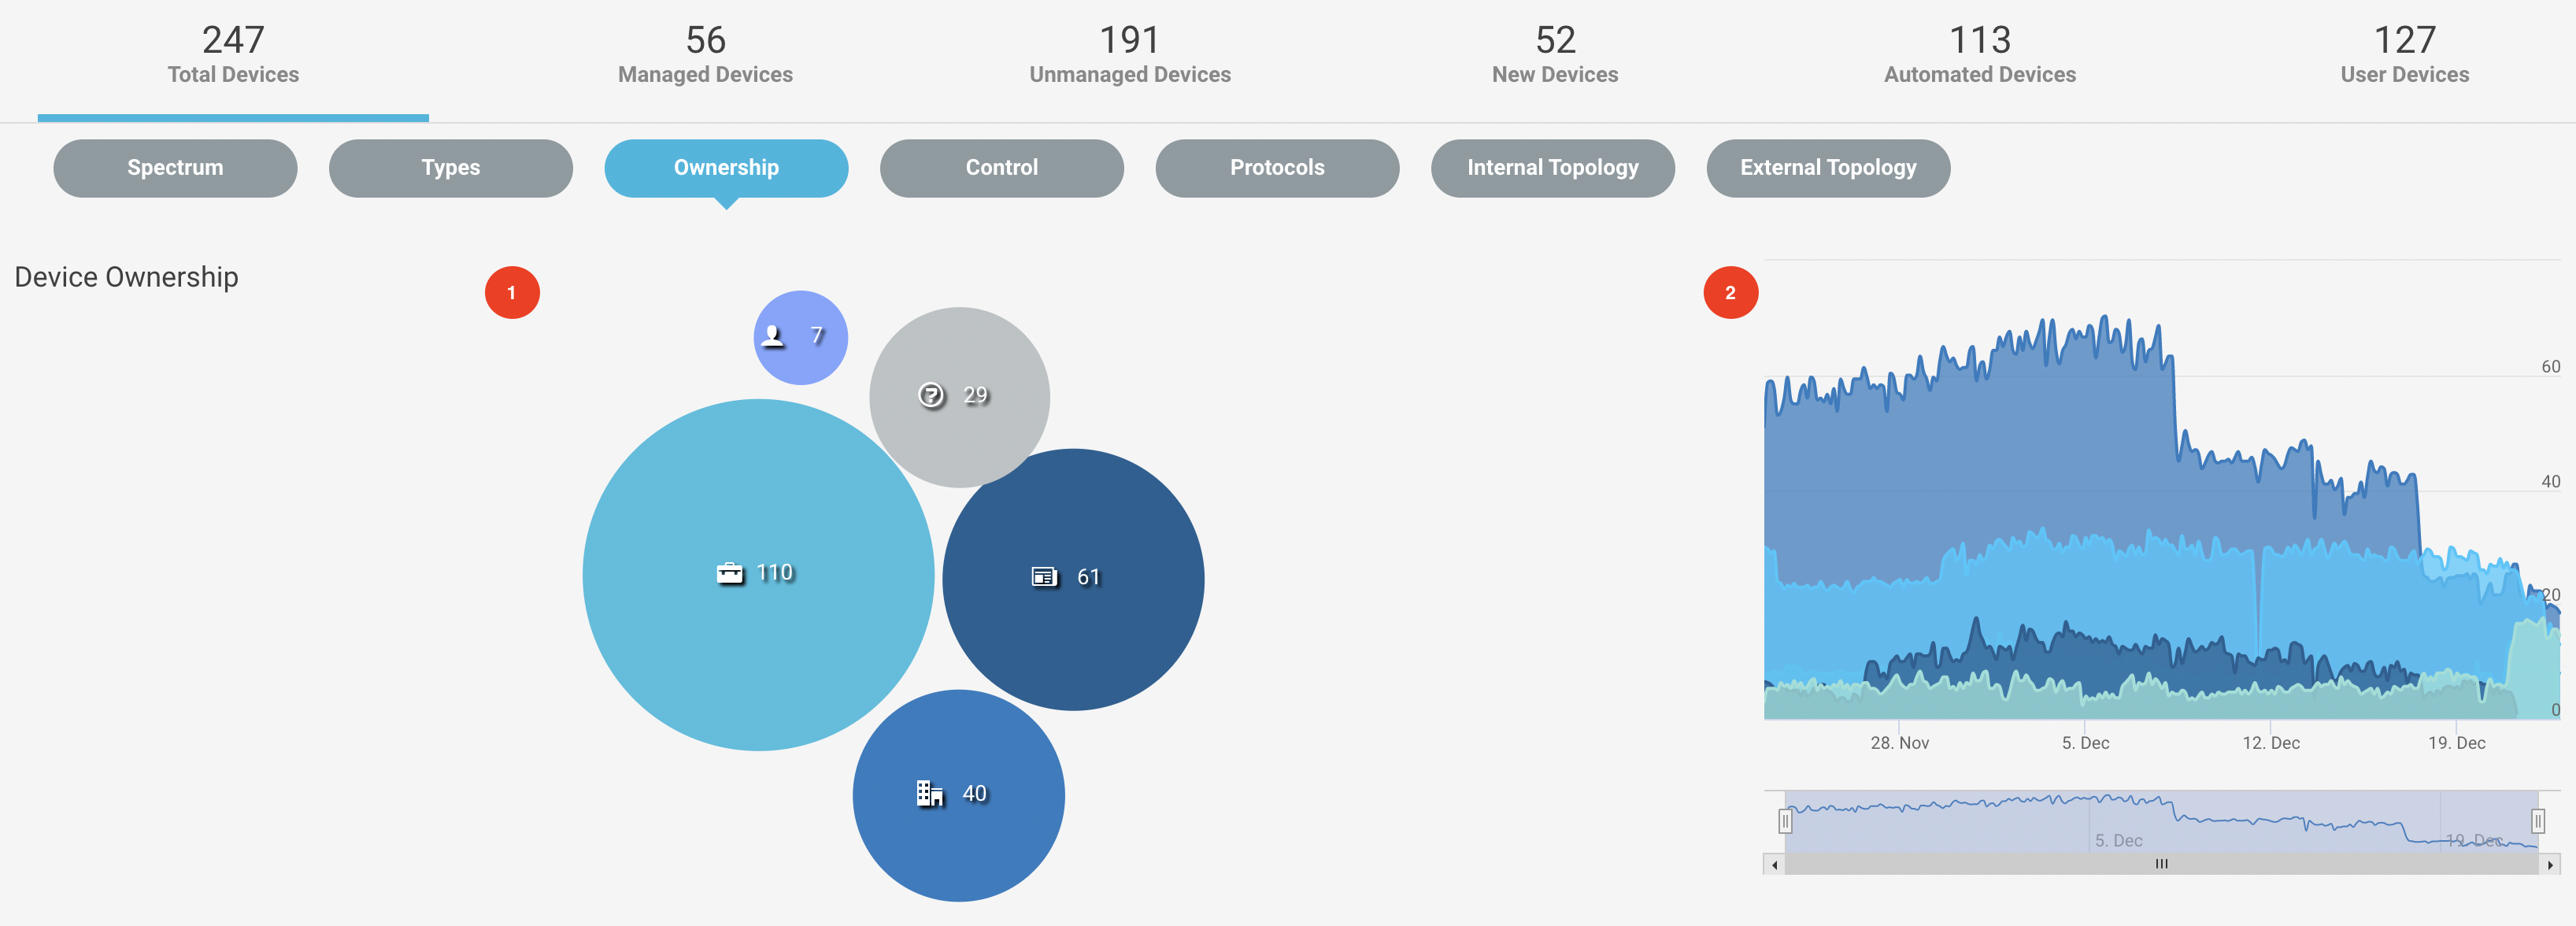 |
The chart shows the number of devices owned by corporate managed and unmanaged devices, employee owned, visiting owners, etc. You can hover over the elements in the pie chart. By clicking on the elements, you can see the inventory details of devices.
The high chart on the right shows the analog representation of the ownership on a specific time stamp.
Investigate Devices based on Control
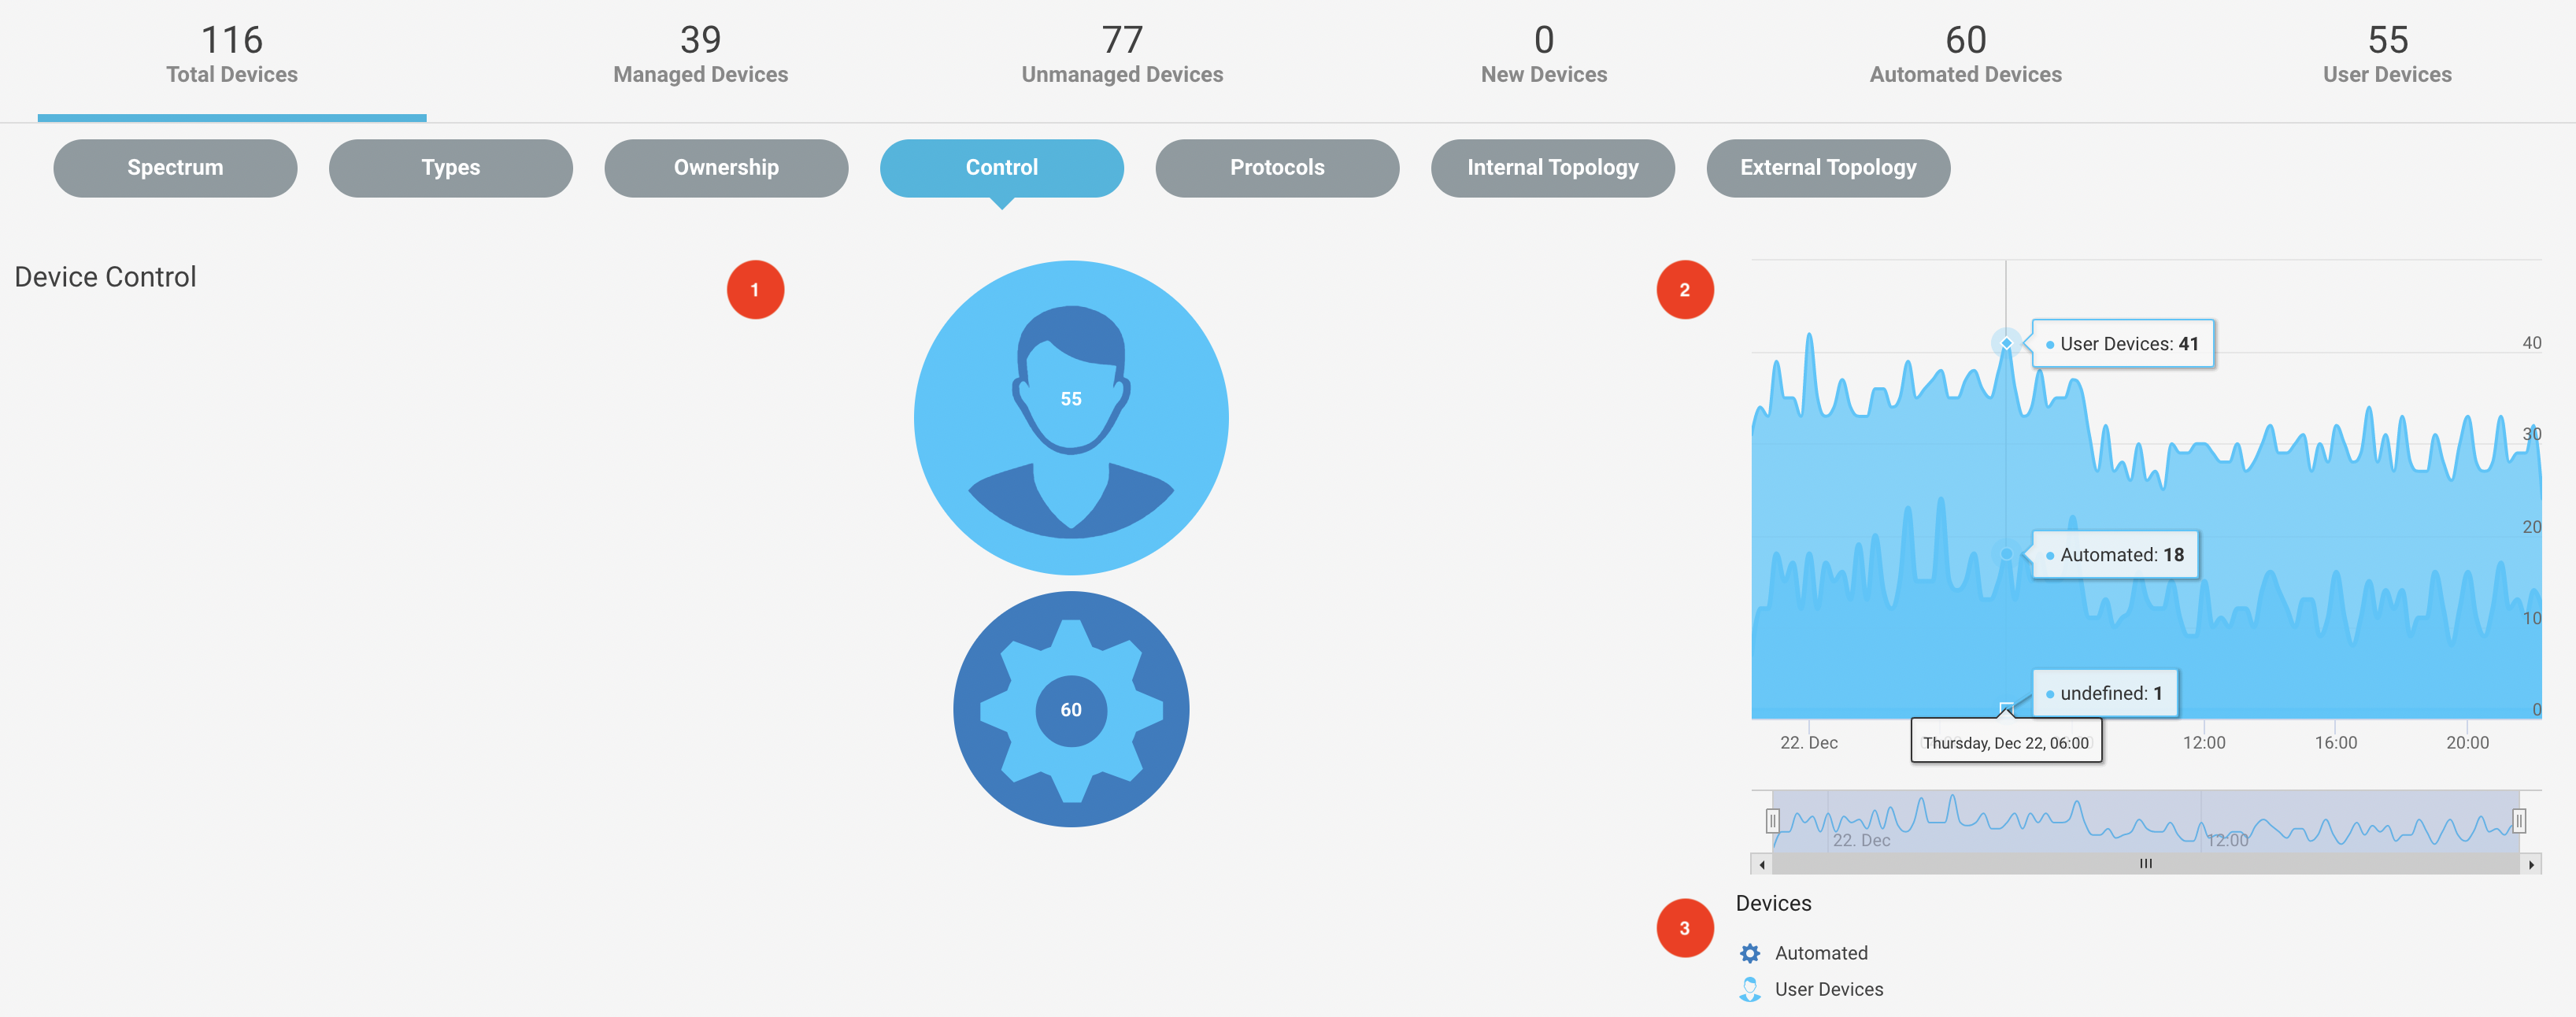
Navigate to Investigate > Devices menu and select the Control tab from the navigation bar to see the statistics of devices controlled manually or automated in the environment. Auto devices are the ones that work automatically without needing human intervention like printers, set-top boxes, smart tvs, thermostats, IoT devices, server computers, etc. These devices exhibit non-human behavior, for example, they are active long hours every day. User devices, on the other hand, are usually controlled by a human and exhibit human behavior, for example, they are not active more than certain hours a day, visit lots of sites, etc. Examples include: smart phones, computers, tablets. Devices can be either auto or user-controlled depending on their function.
 |
 |
You can see the number of devices controlled manually and automatically in the chart. You can hover over the elements in the pie chart. By clicking on the elements, you can see the detailed device summary.
The high chart on the right shows the analog representation of the devices based on the control aspect on a specific time stamp.
You can filter the chart results by toggling the elements in the devices class.
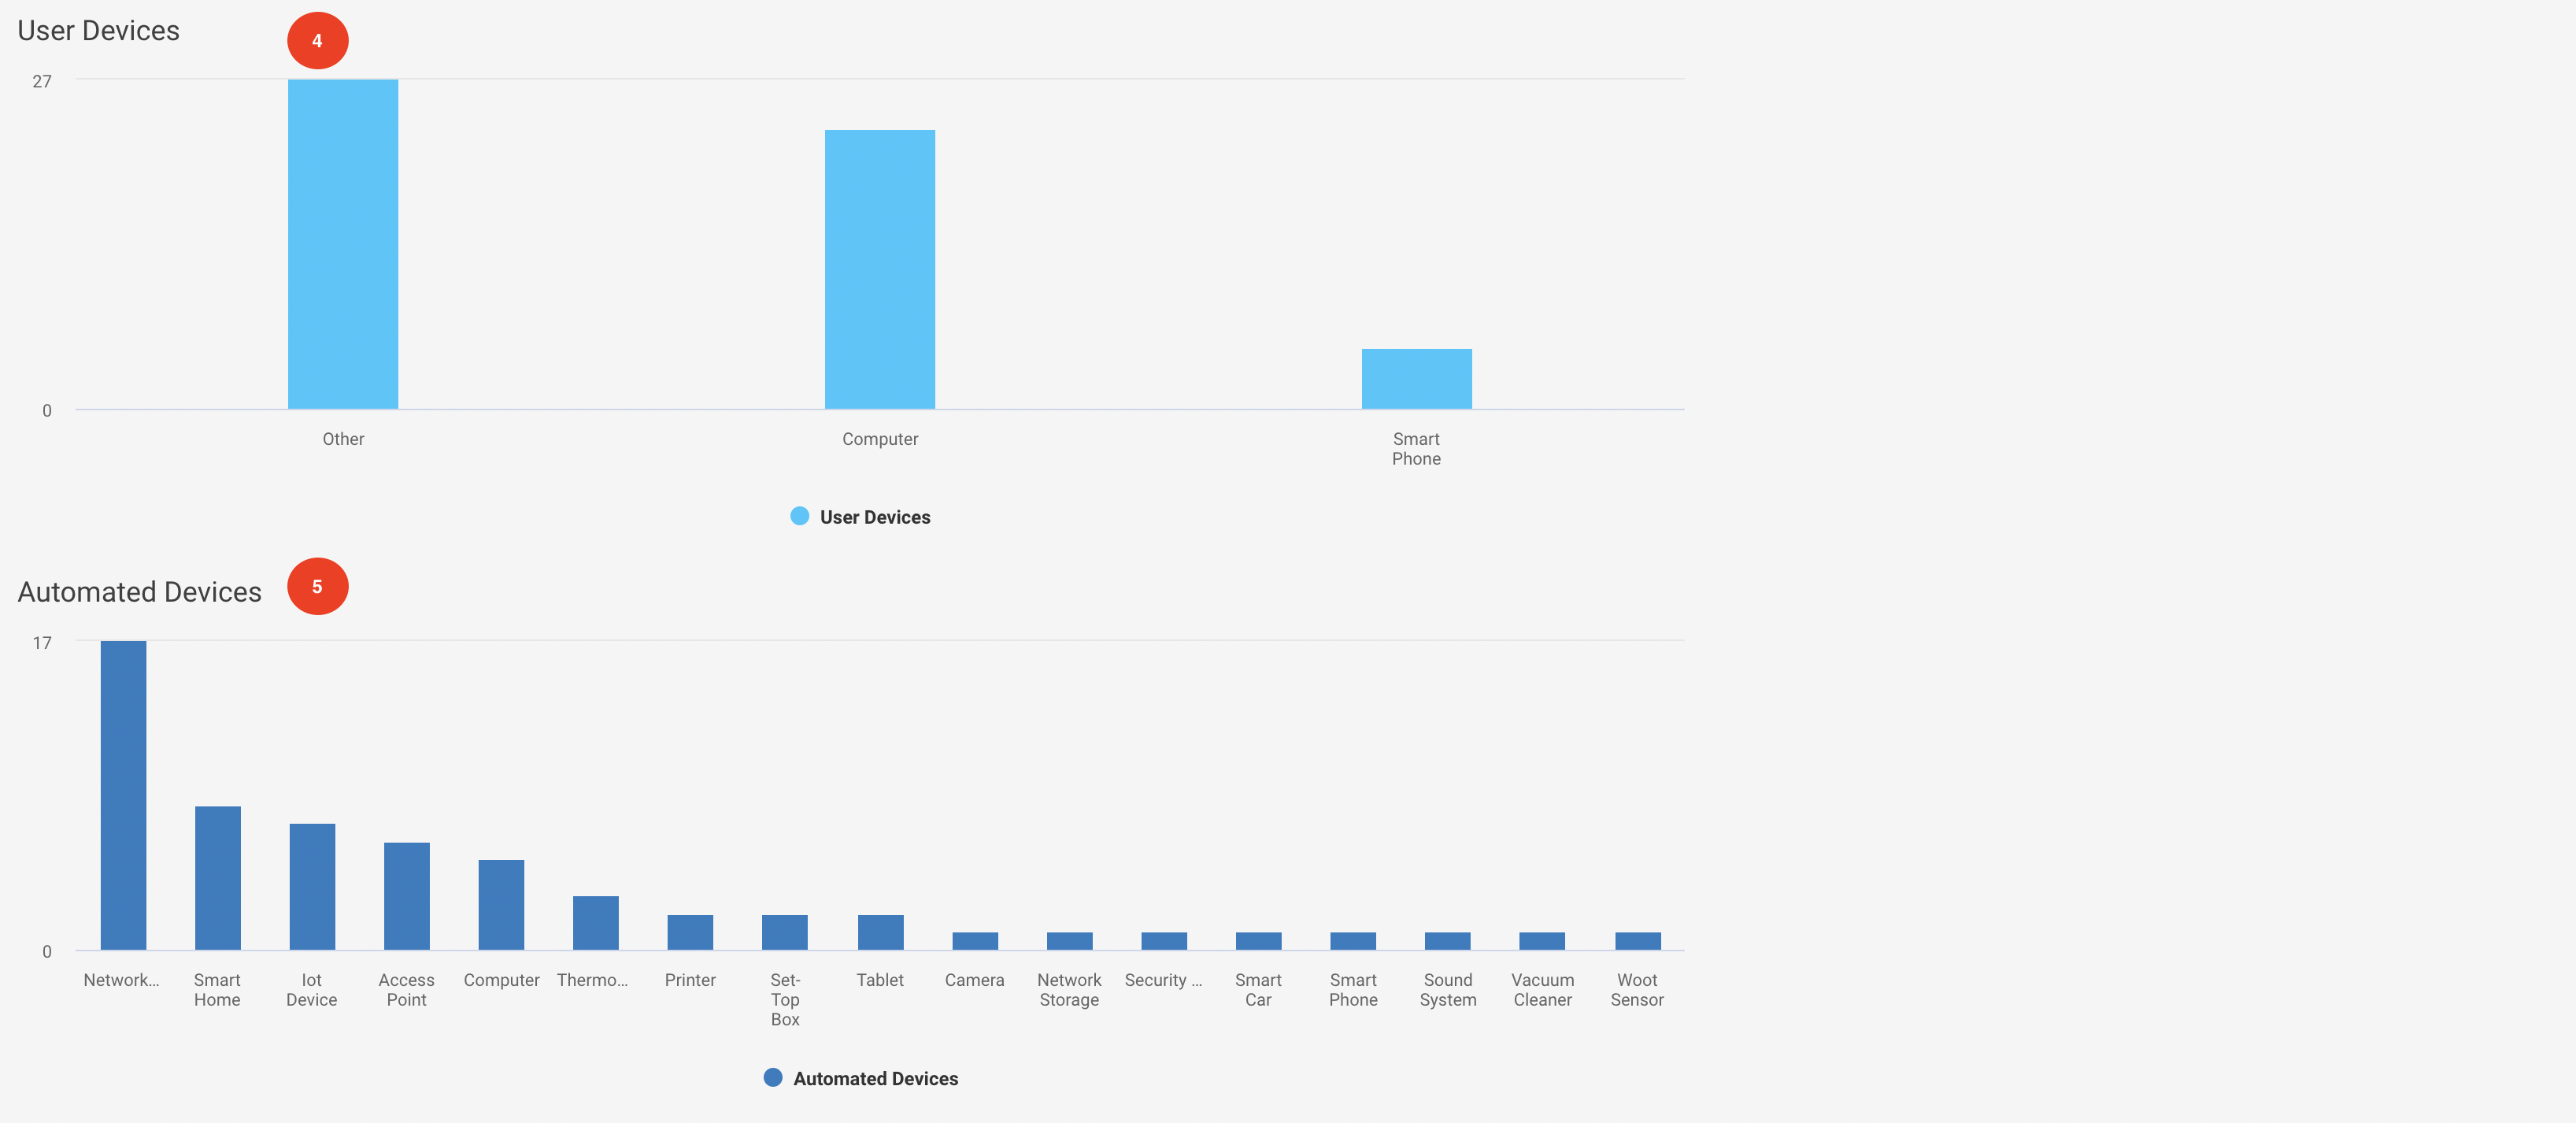
The bar graph shows the distinct user-controlled devices.
The bar graph shows the distinct automatically controlled devices.
Investigate Devices based on Protocols
Navigate to Investigate > Devices menu and select the Protocols tab from the navigation bar to see the devices based on different device protocols used in the environment.
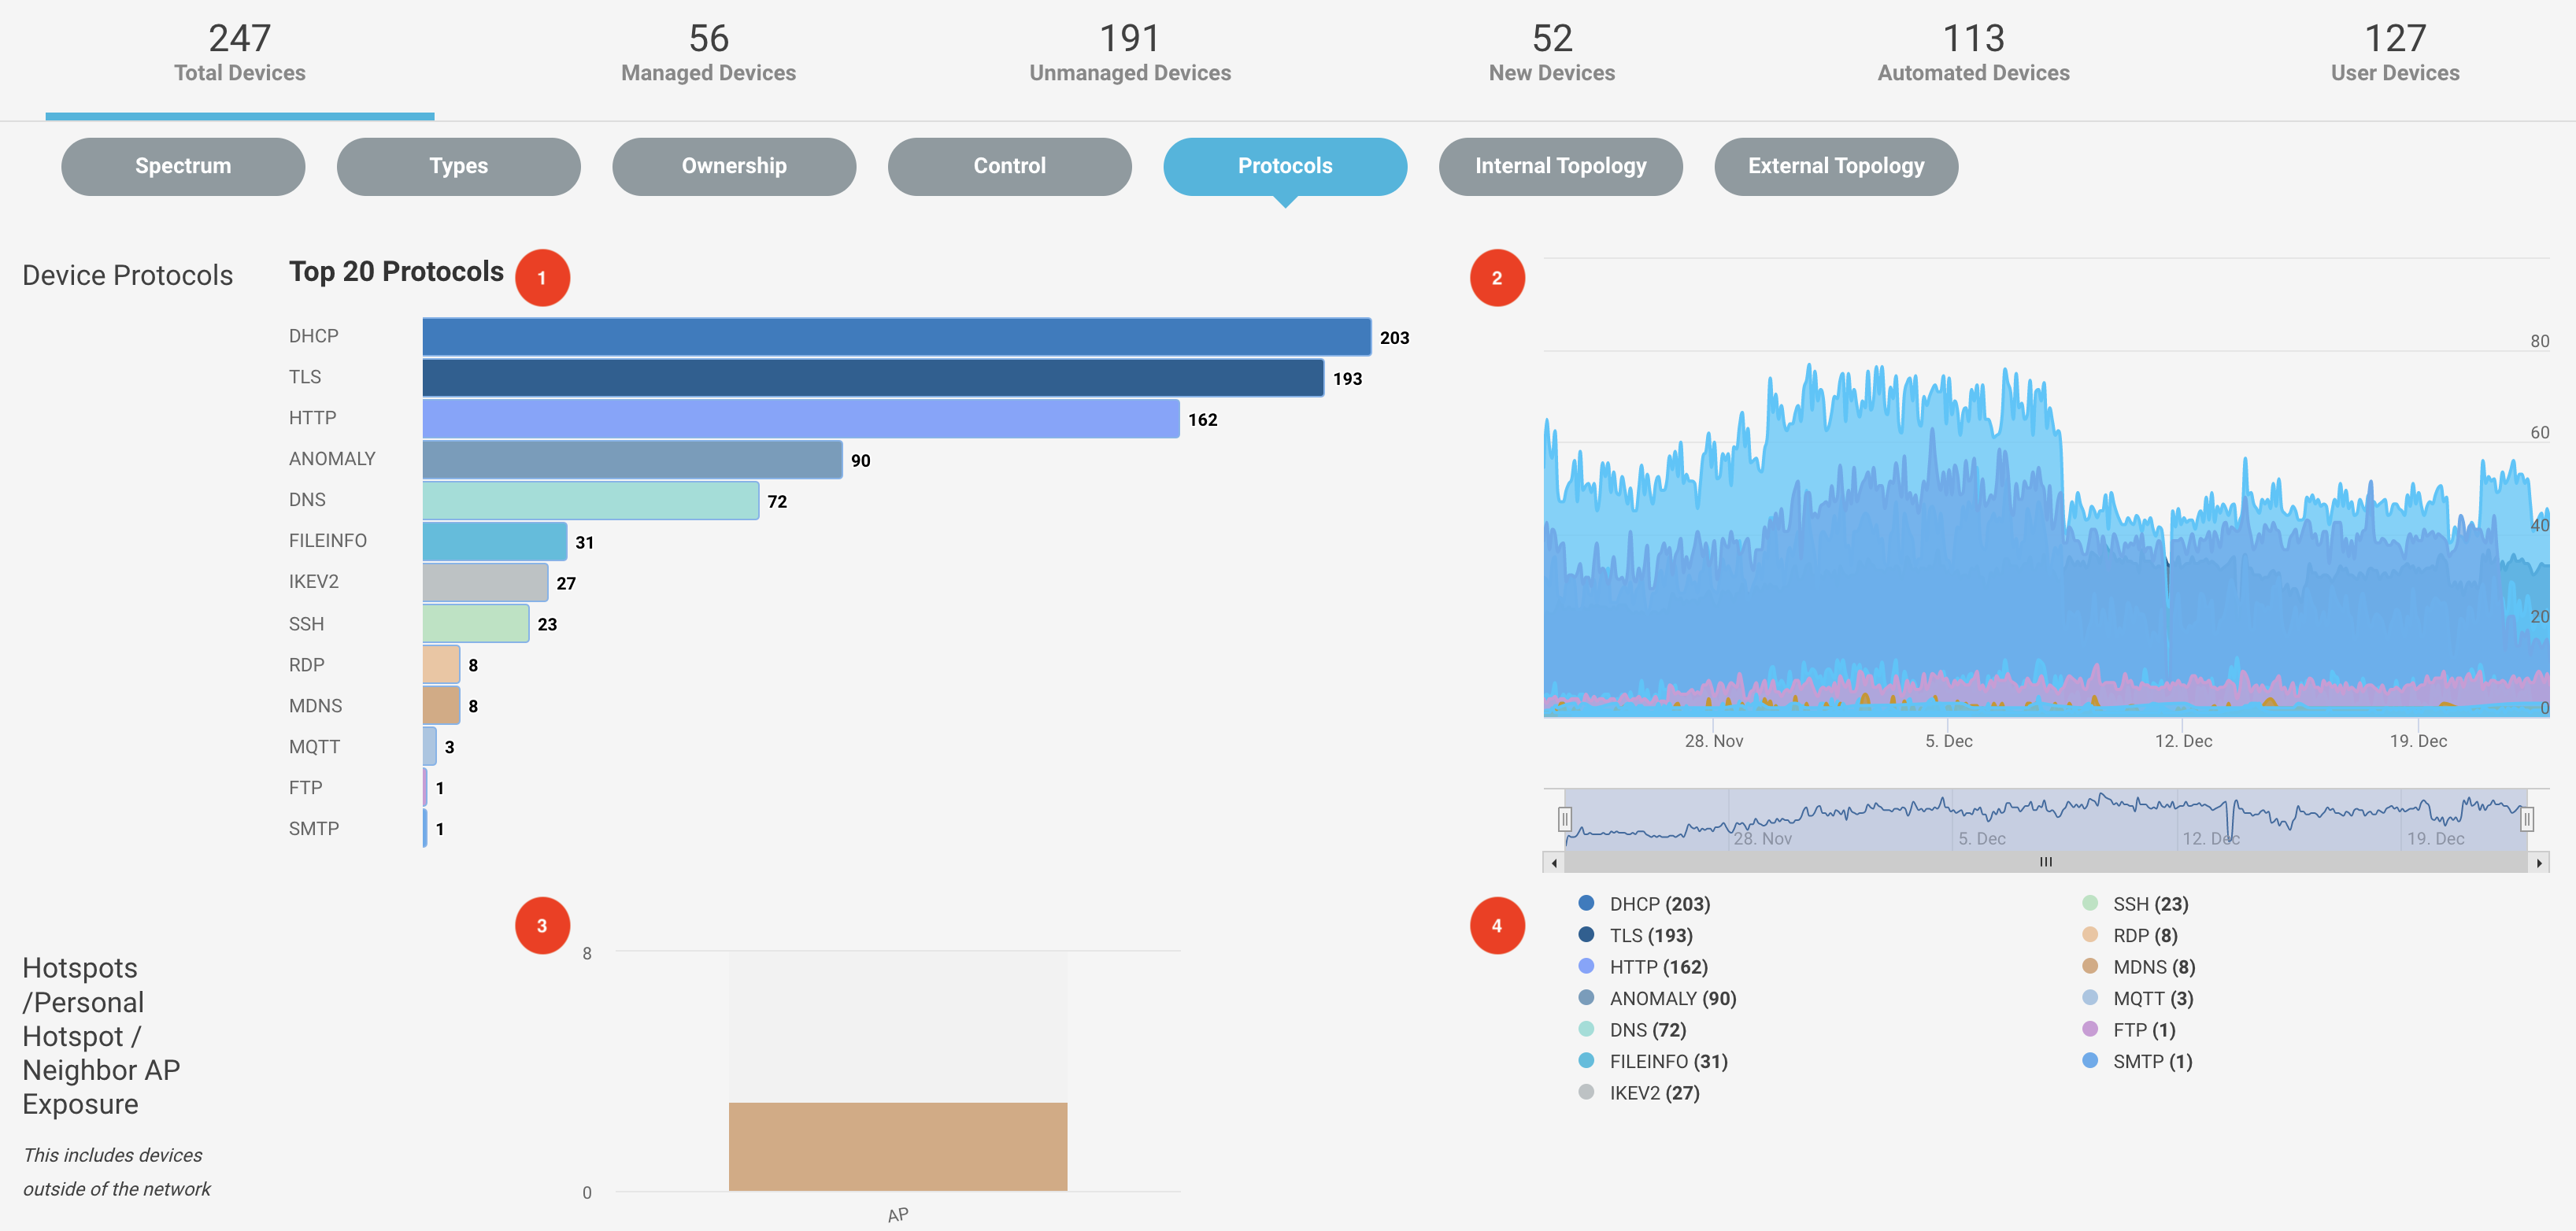 |
You can see a bar chart with distinct protocols and the count of devices beside it. By clicking on the elements, you can see the detailed device summary.
The high chart on the right shows the analog representation of the protocol usage on a specific time stamp.
Hotspots /Personal Hotspot / Neighbor AP Exposure section shows discovered Wi-Fi hotspots and exposed neighboring access points. The list contains devices outside of your network.
You can filter the chart results by toggling the protocols from the list.
Investigate Devices based on Internal Topology
Navigate to Investigate > Devices menu and select the Internal topology tab from the navigation bar to see the device topology in the environment.
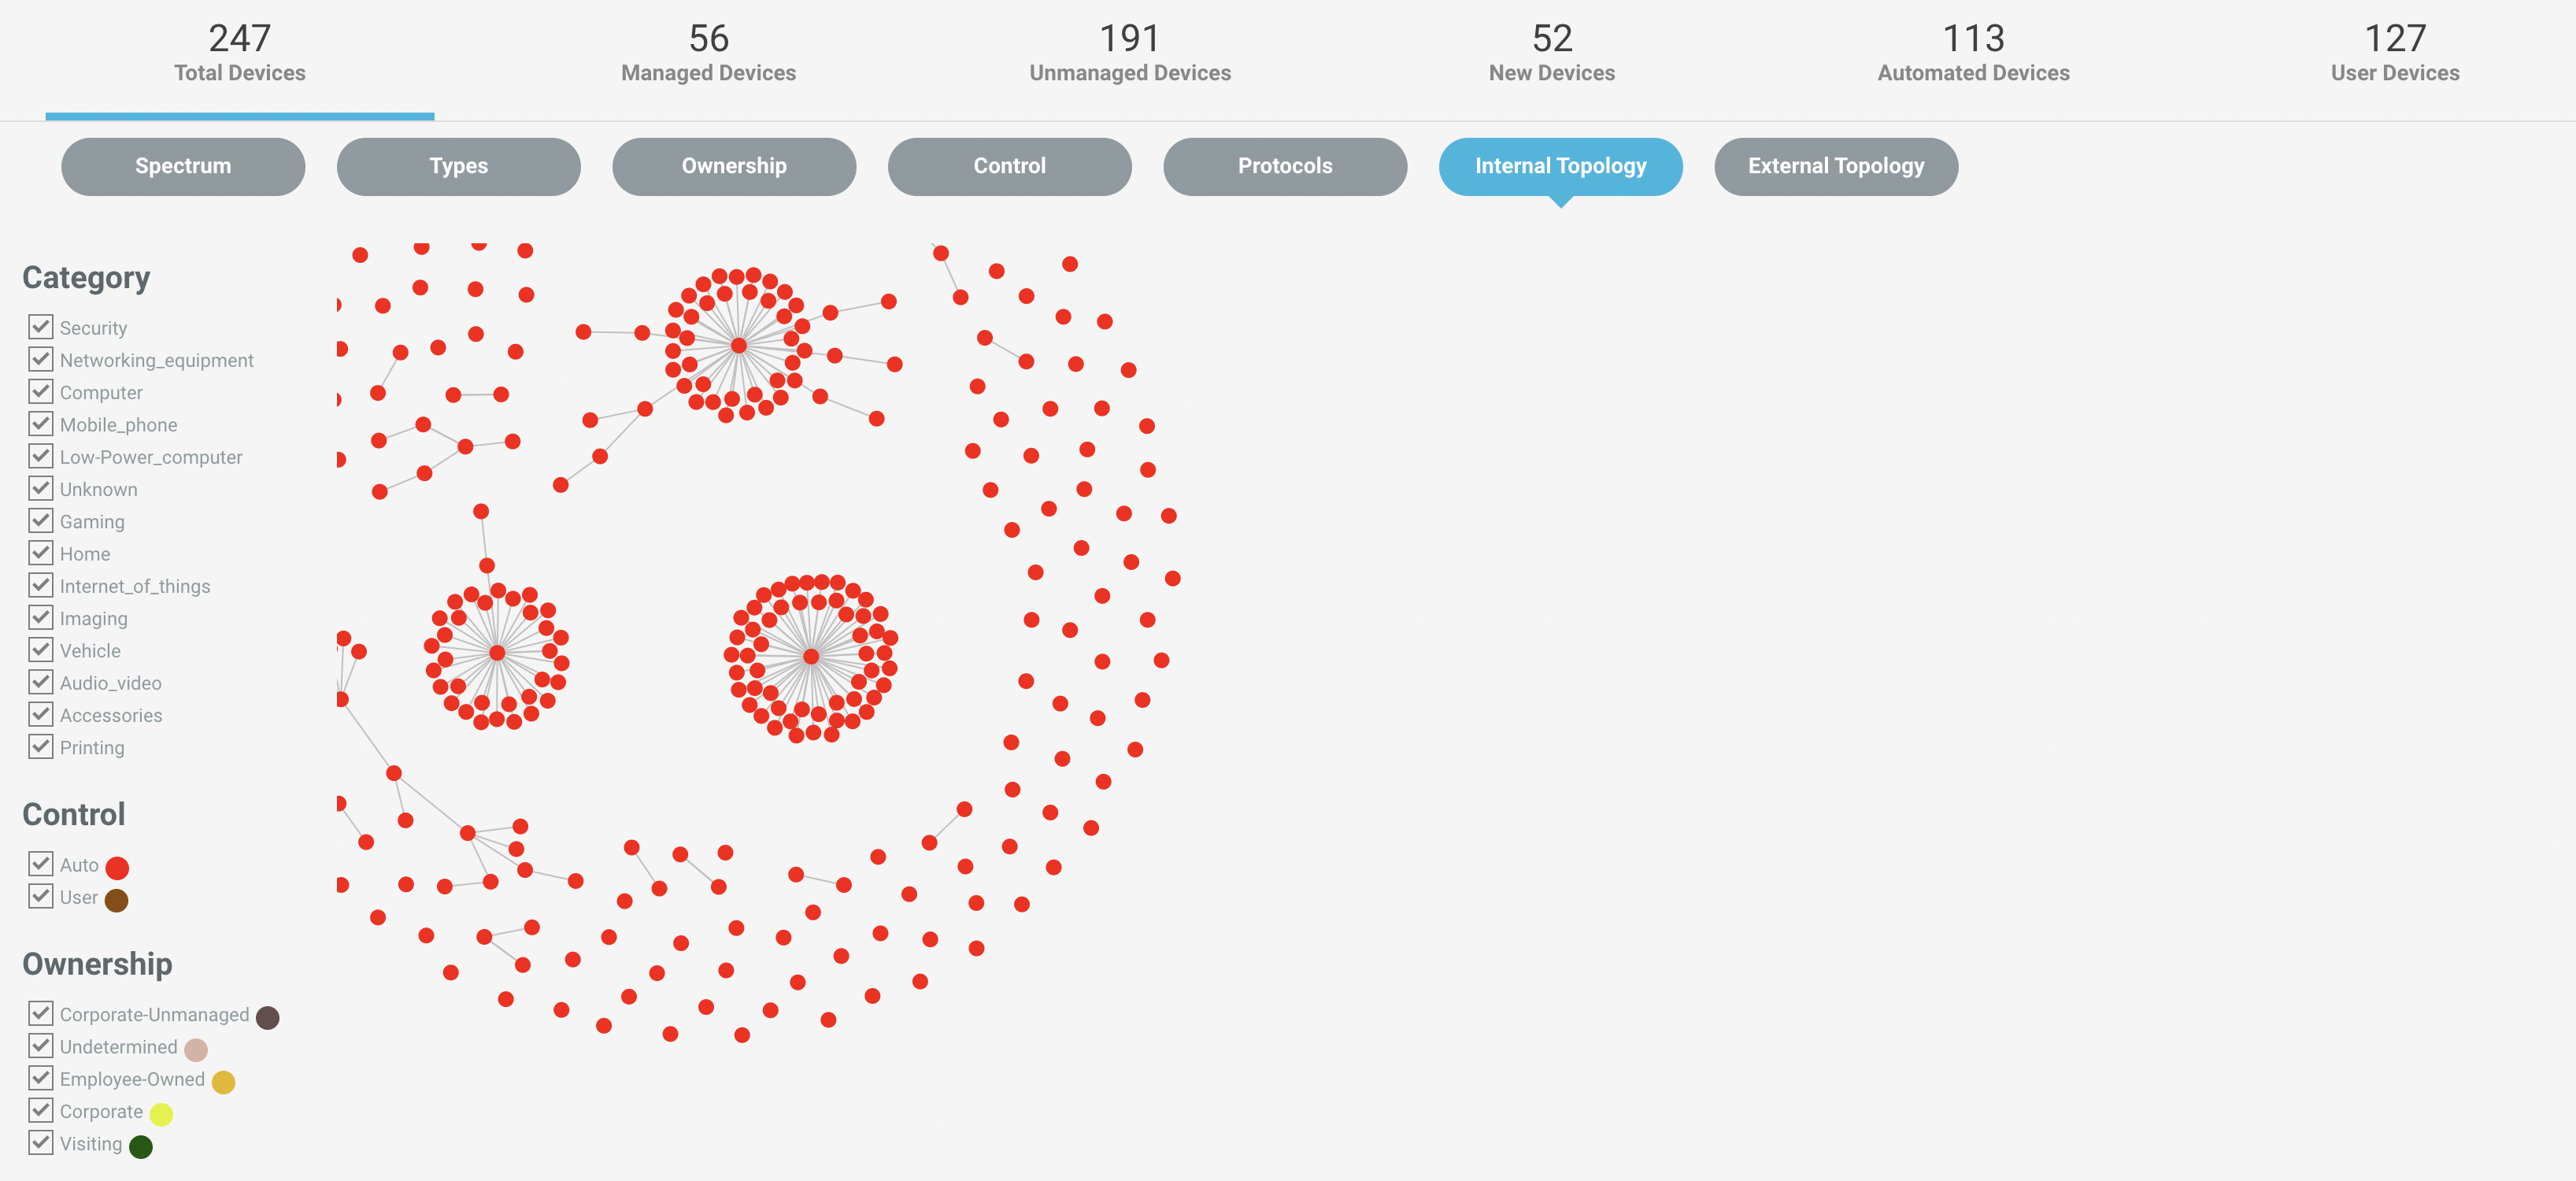 |
You can see a fluid topology chart with all the parameters, like device category, control mode, ownership, protocols, type, etc in the topology. You can also filter out the chart results by playing with the filters.
Investigate Devices based on External Topology
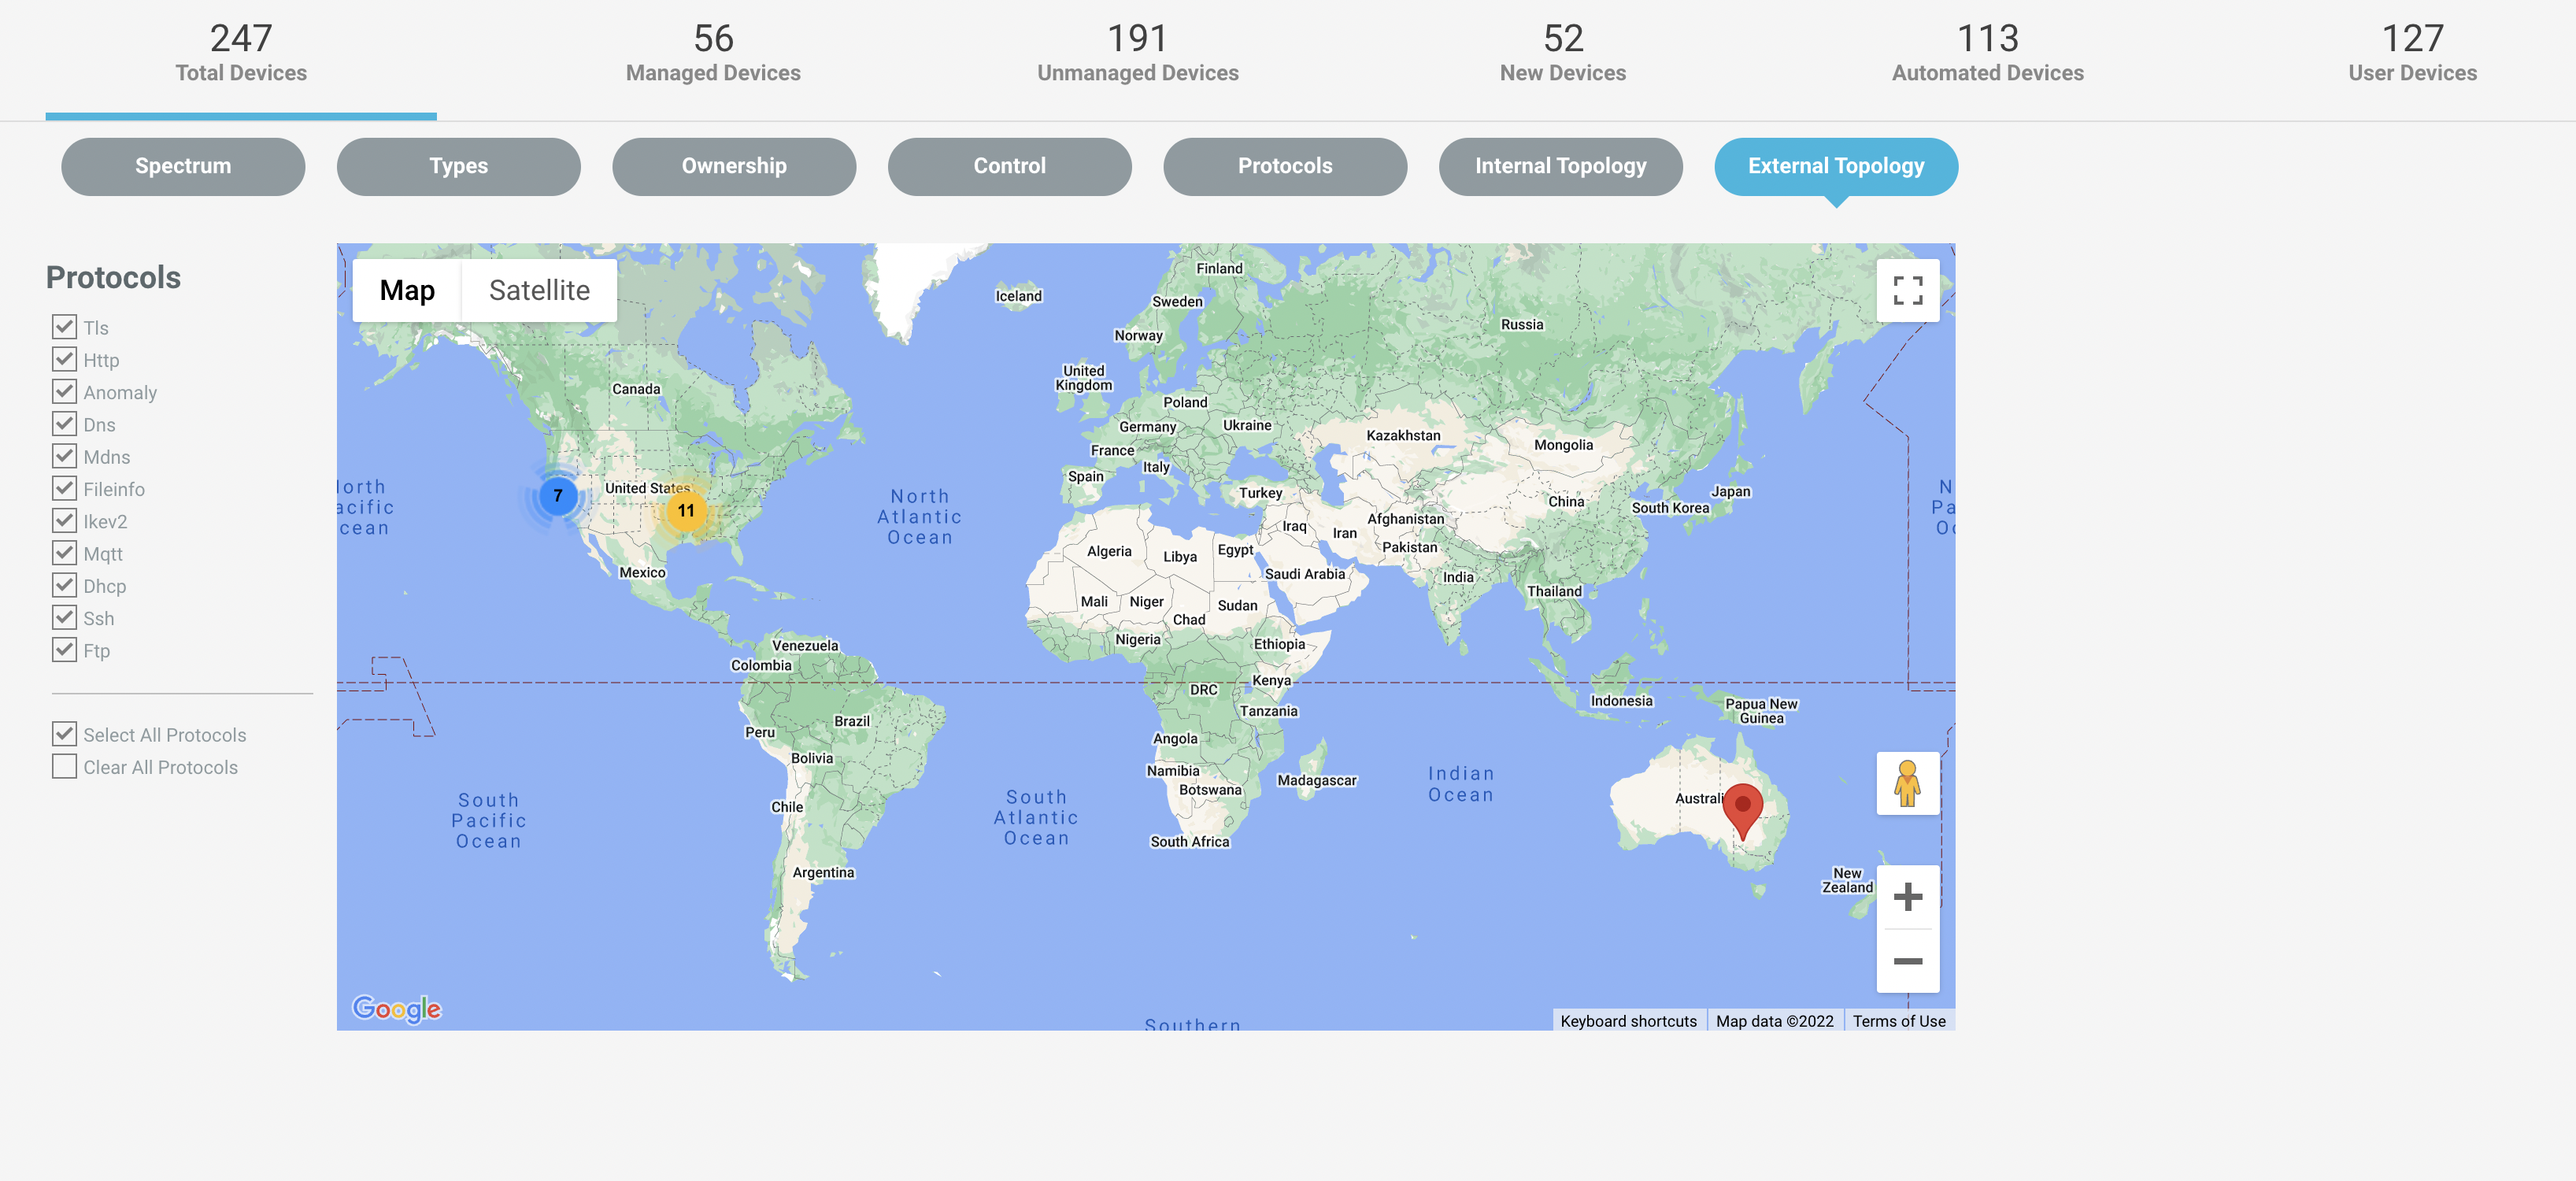
Navigate to Investigate -> Devices menu and select the External topology tab from the navigation bar. It is the communication network of your devices to external destinations.
 |
Investigate Events
Navigate to Investigate > Events menu to see a list of events captured on the devices. You can see the number of events with high, medium and low severity at the top right of the screen, which can be used to sort the event results by clicking on the circles.
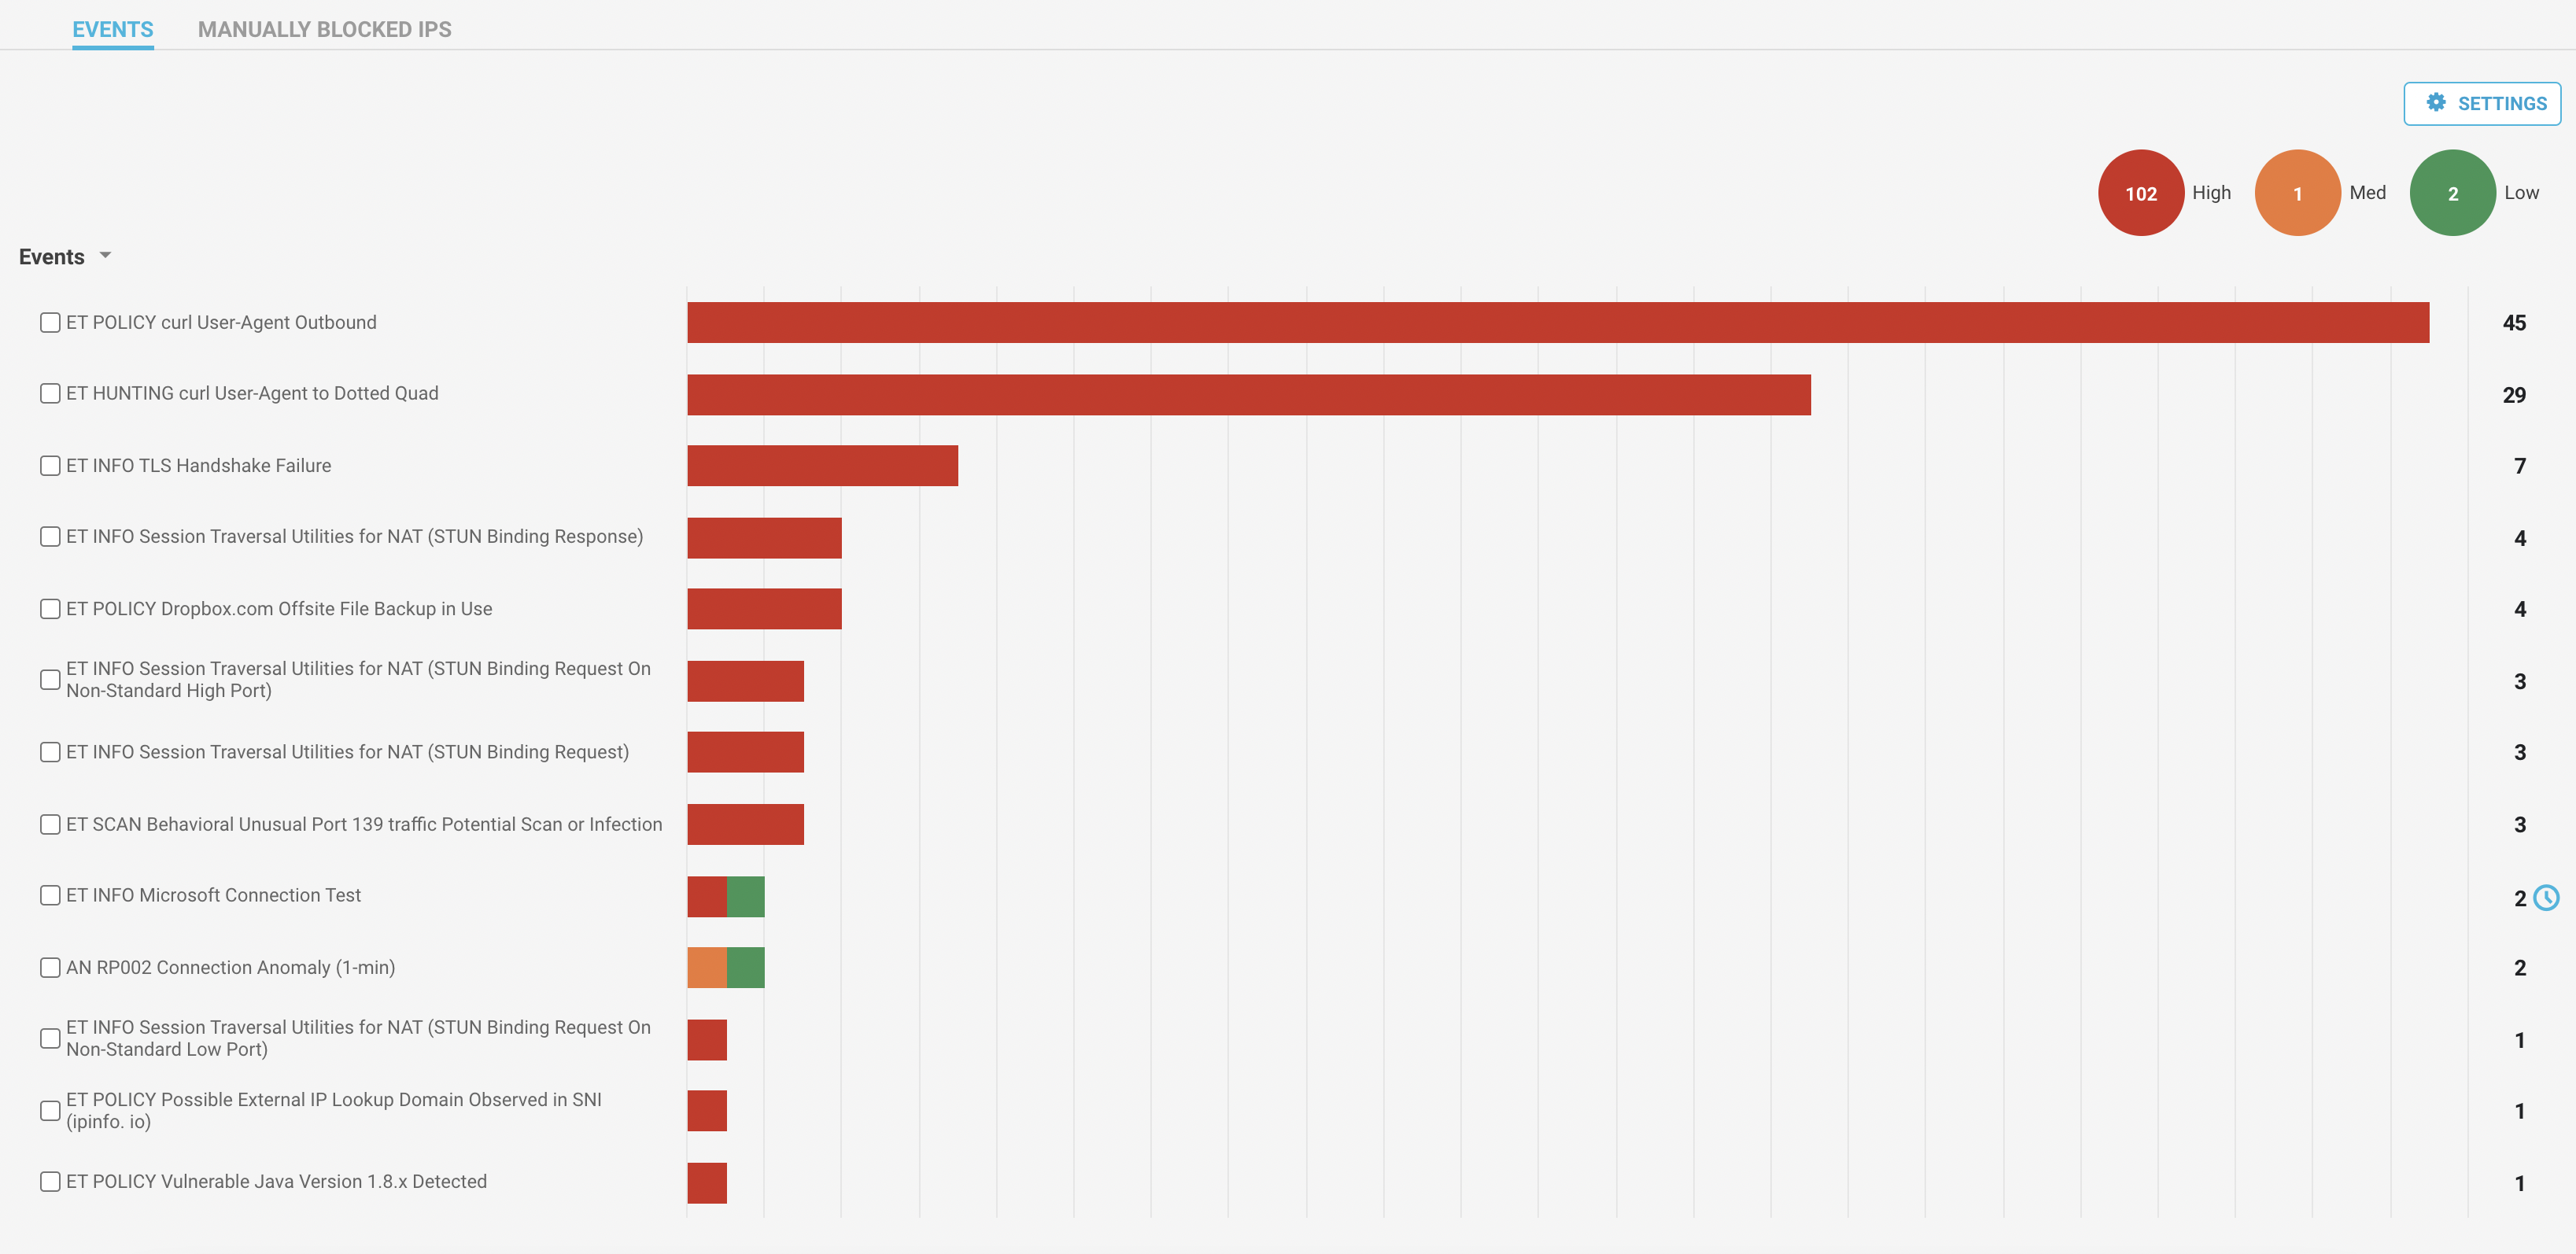 |
The page shows the list of events with the number of occurrences. You can click on the individual events to see the detailed information of the devices with the issue. To remediate the issues, you can select the one or multiple events to create policies or change the severity of the event.
 |
Timer symbol indicates that the event was modified or filtered. Clicking on the timer symbol shows the details.
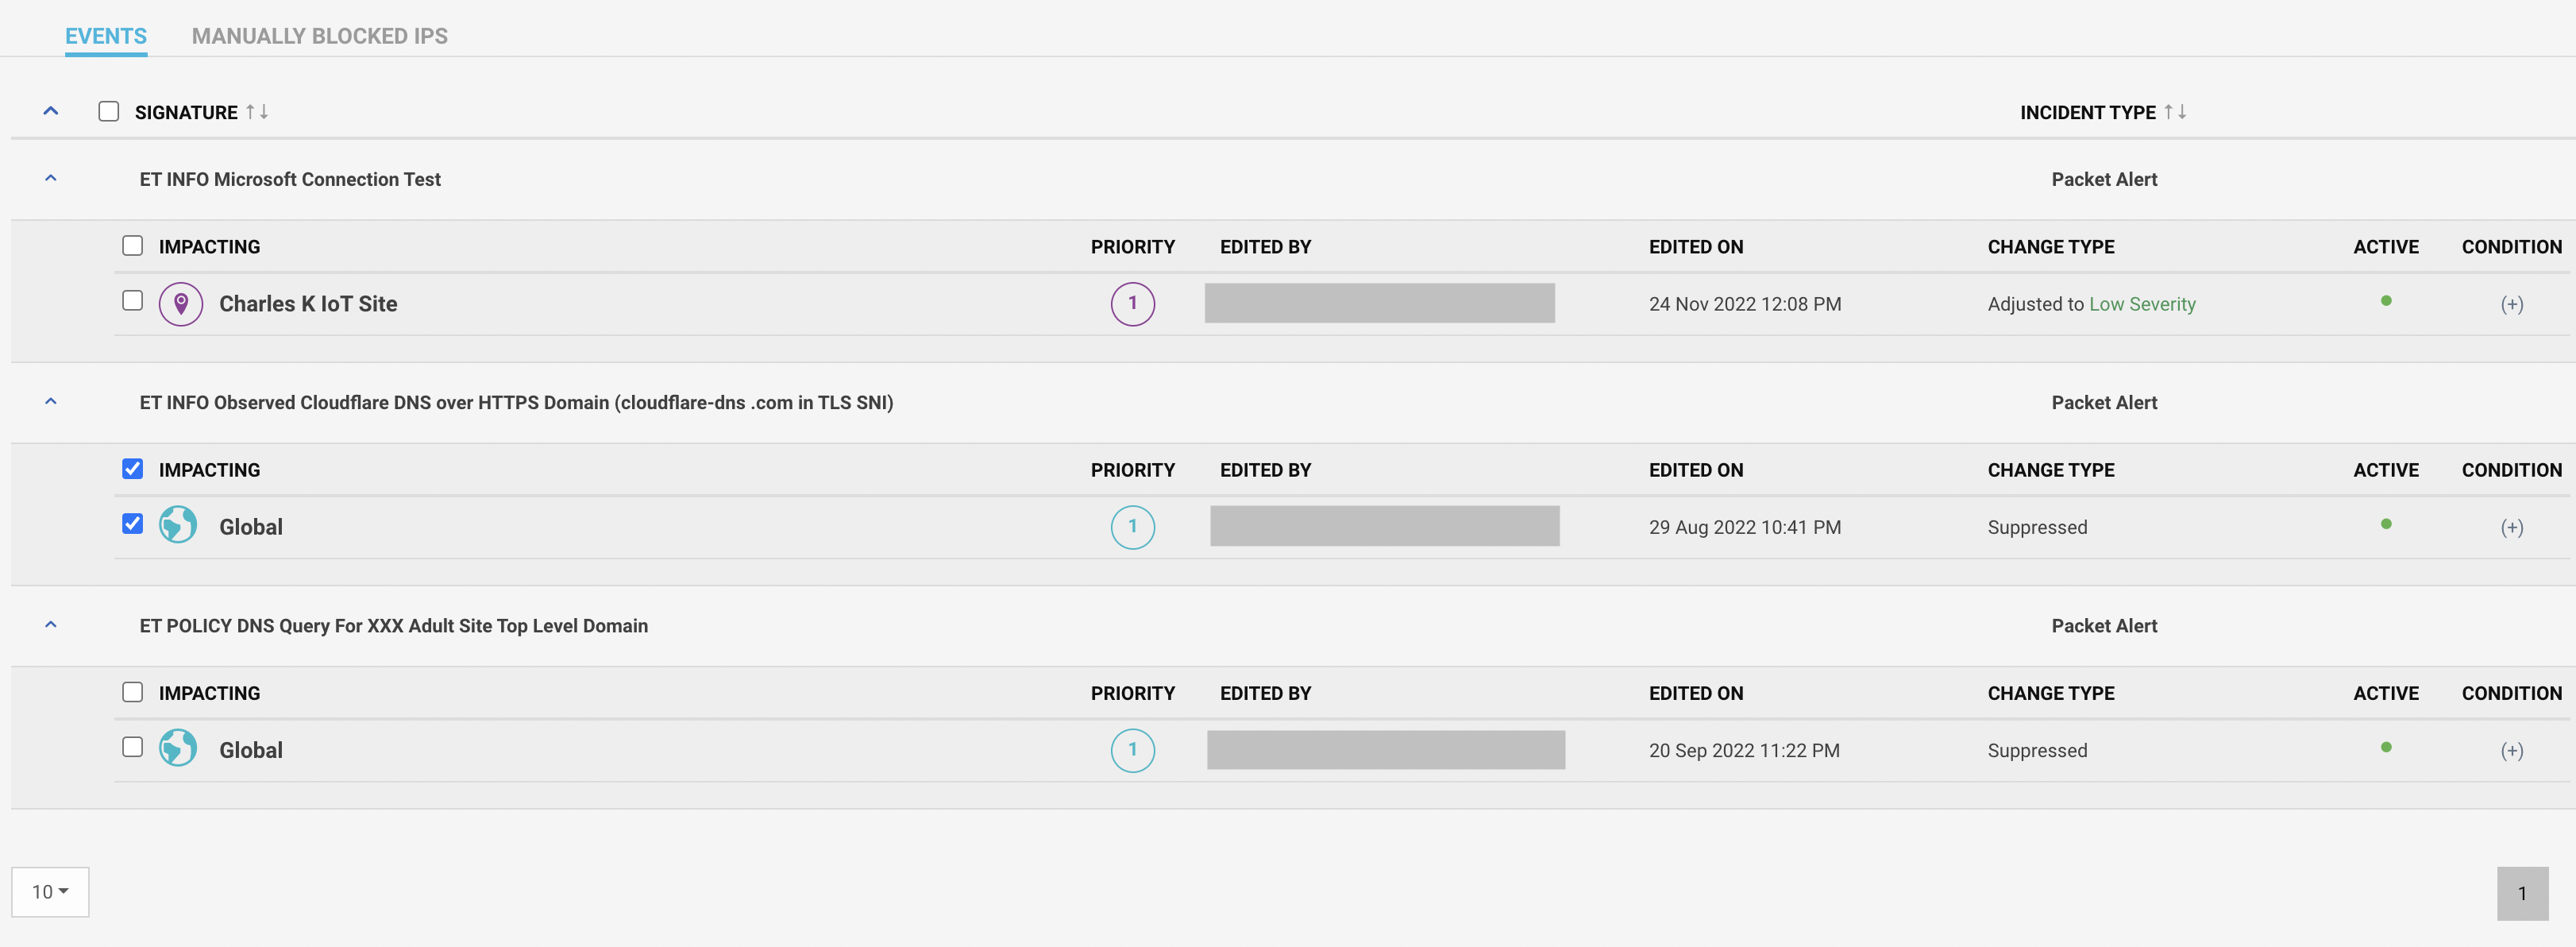 |
Navigate to the Settings button on the top right of the screen. The page shows the list of modified events.
Manually Blocked IPs
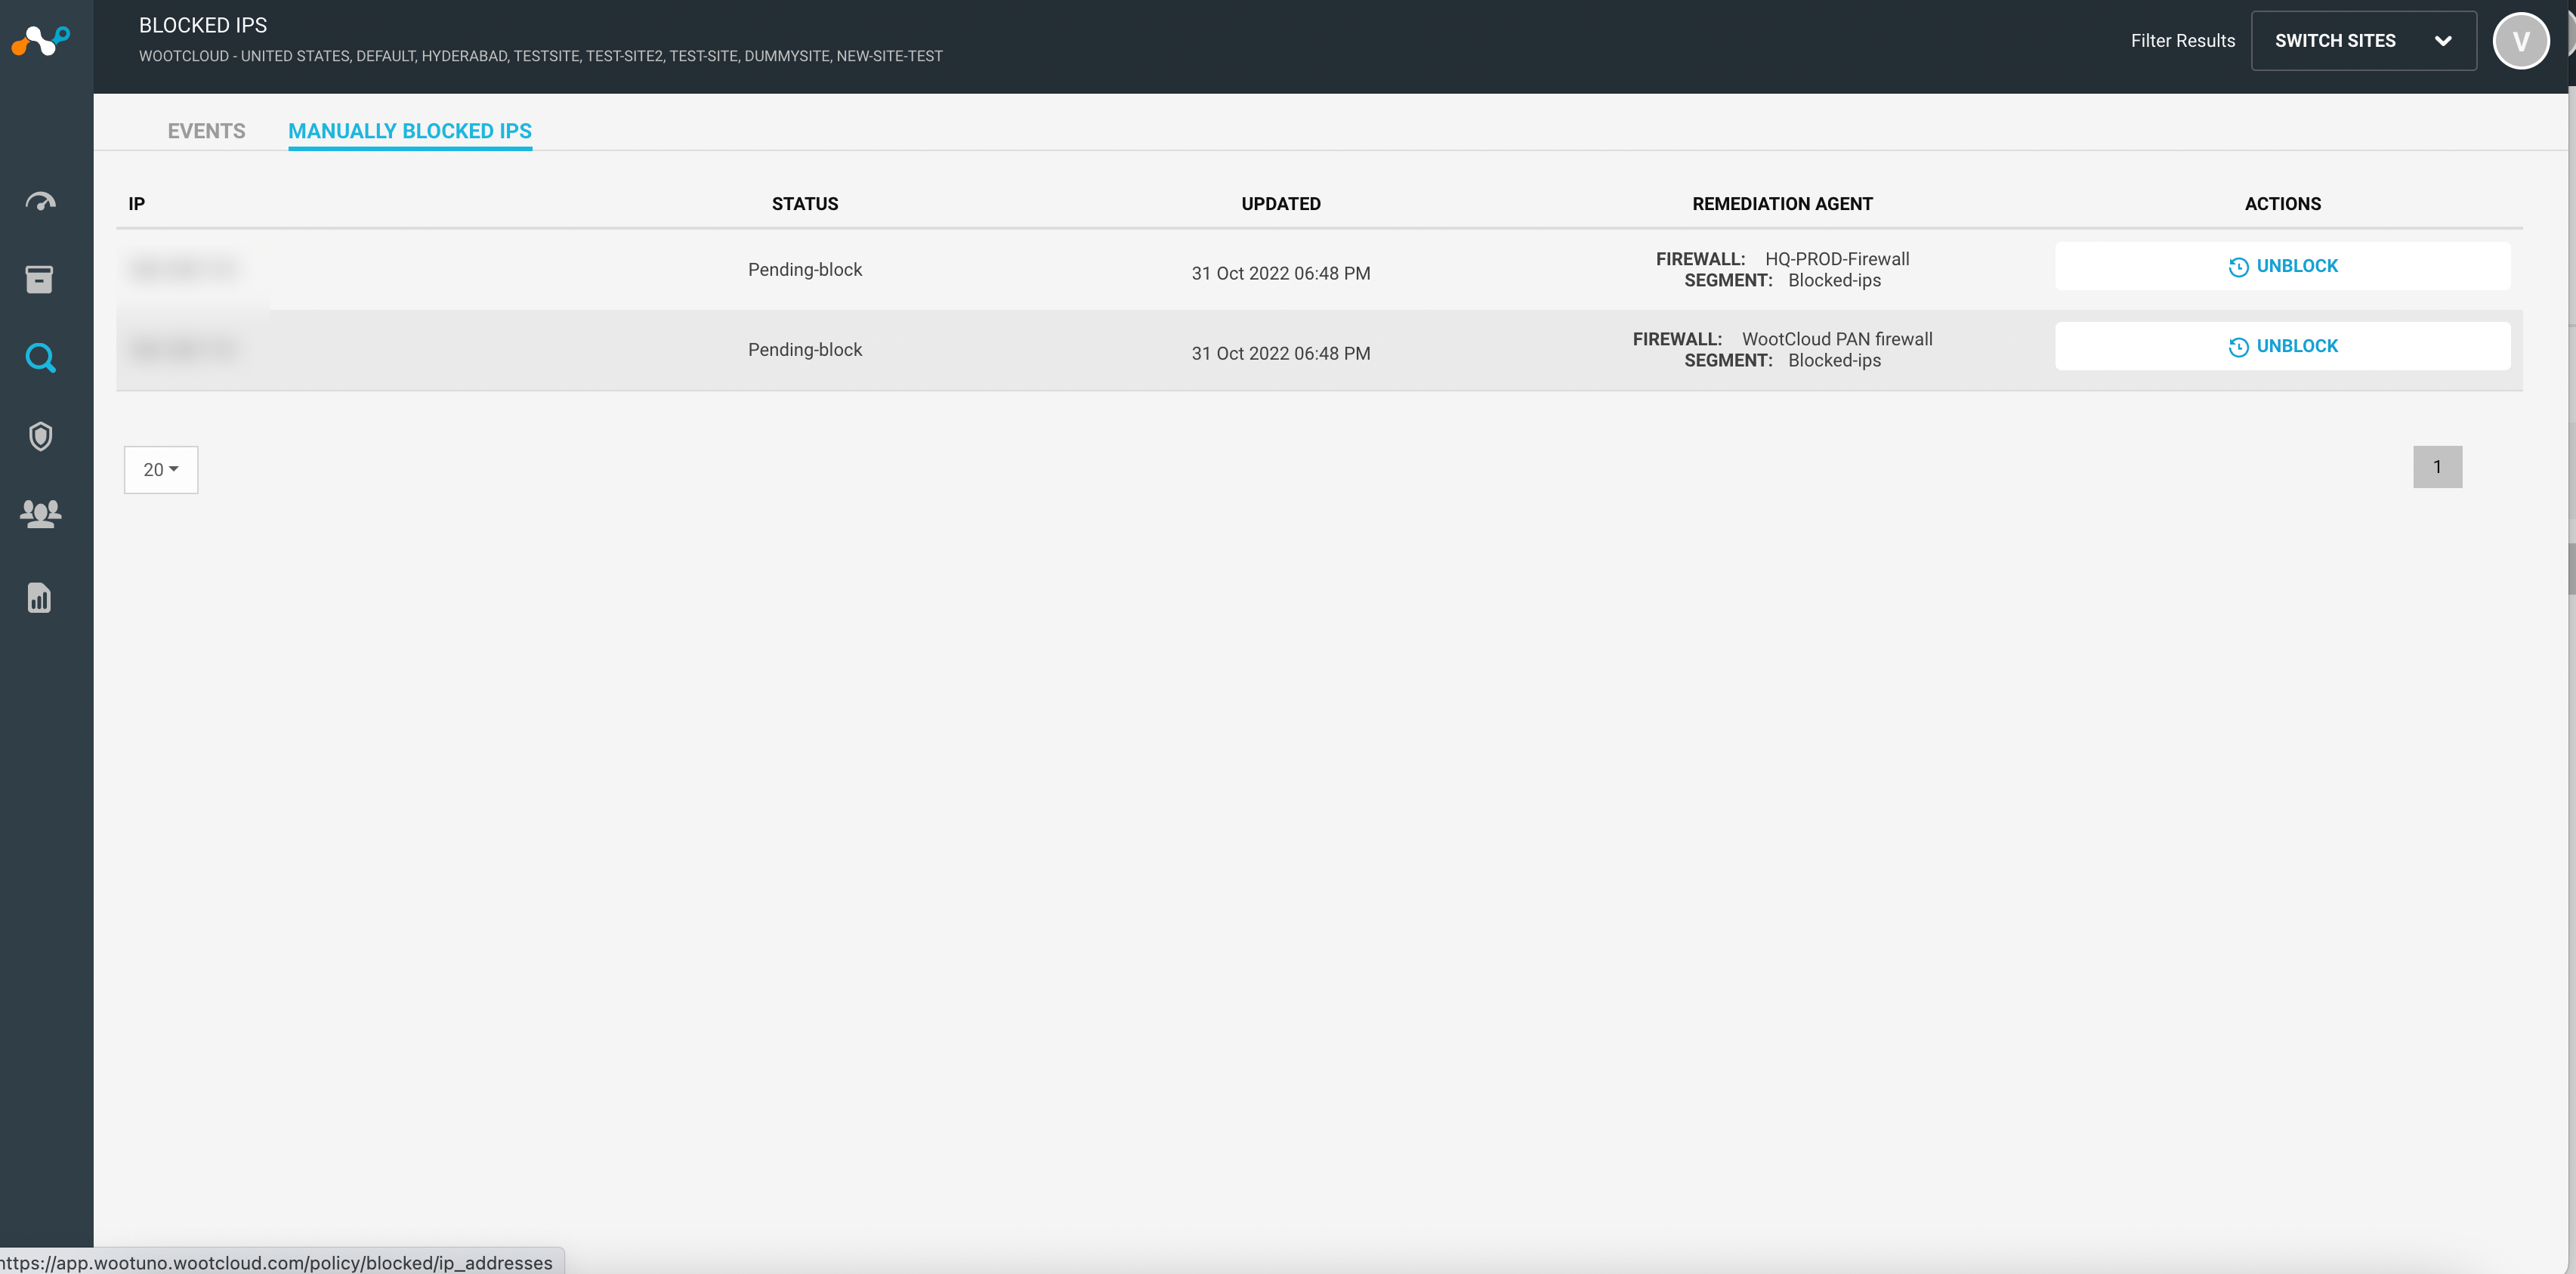
The Manually Blocked IPs section lists all the blocked device IPs. You can also unblock the devices by clicking on the Unblock button.
 |
Investigate Risks
Navigate to Investigate > Risks menu to see a list of devices with high, medium or low priority. The screen provides the event view and device view for the information representation. You can see the number of devices with risk at the top right chart.
Events view shows the information in device summary and event drill down table.
 |
You can see the host name, type, tags assigned and managed or unmanaged information.
Click on the details link to see the device summary.
You can see the risk score calculated by the Netskope proprietary risk engine, which categorizes packet alerts, device software vulnerabilities and device behavior anomalies into threat vectors.
It shows if the device is Wi-Fi, wired or undefined interface connected.
You can see the operating system and site assigned information. It shows if the device is user or automatically controlled.
Displays a list of risk factors with severity and number of occurrences. You can create policy by selecting one or multiple risk issues or modify the severity of the risks.
Device view shows the information in the Inventory menu with risk severity search.
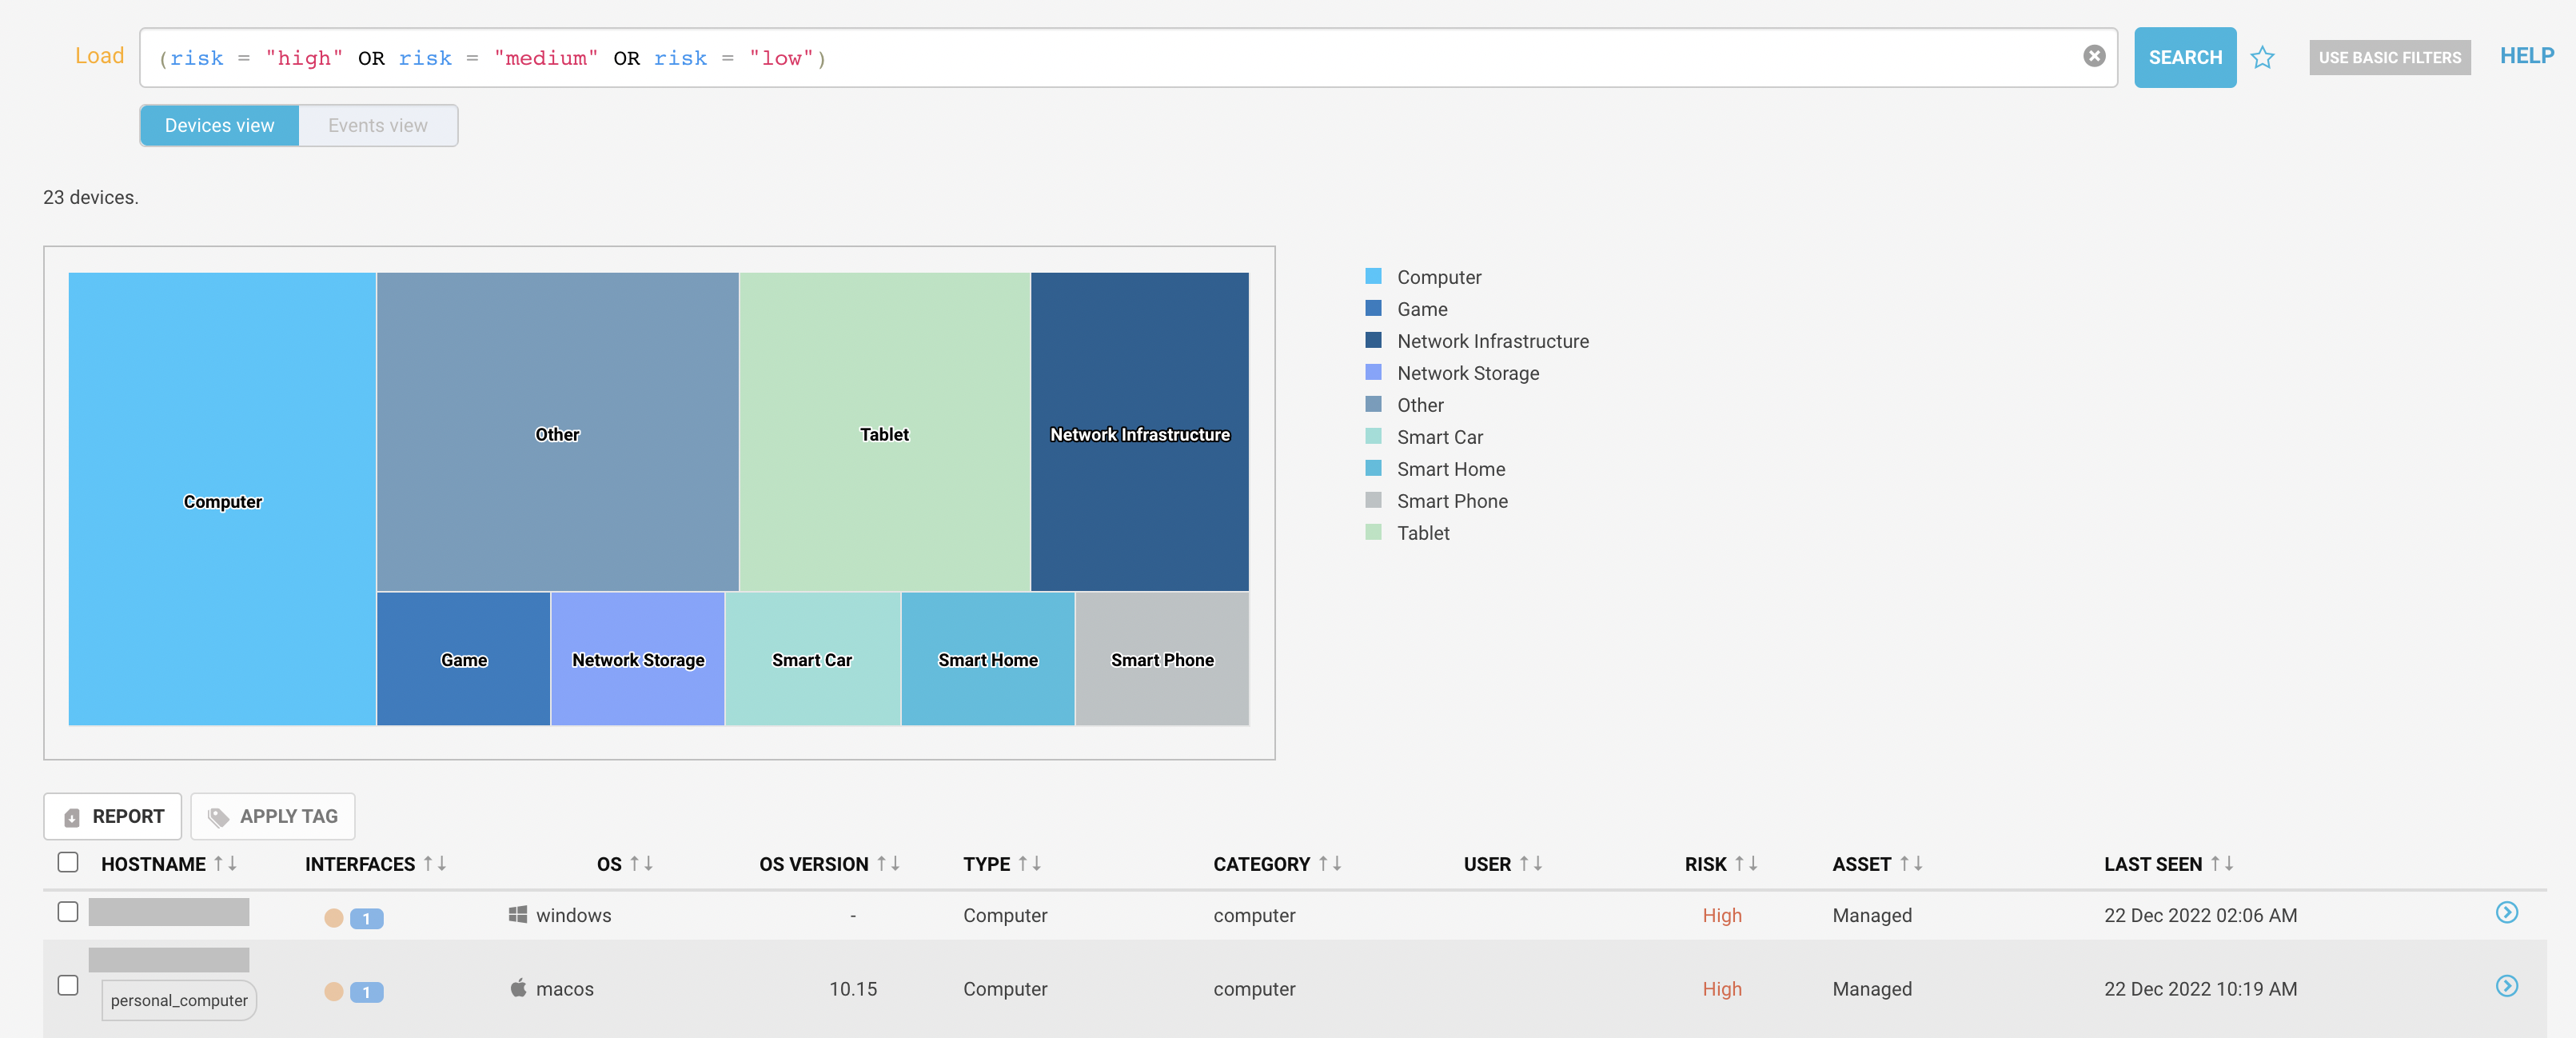 |
Device Details
Navigate to the Investigate > Risks menu and click on the details link of any device from the device summary screen. You will see detailed information about the device and the risks.
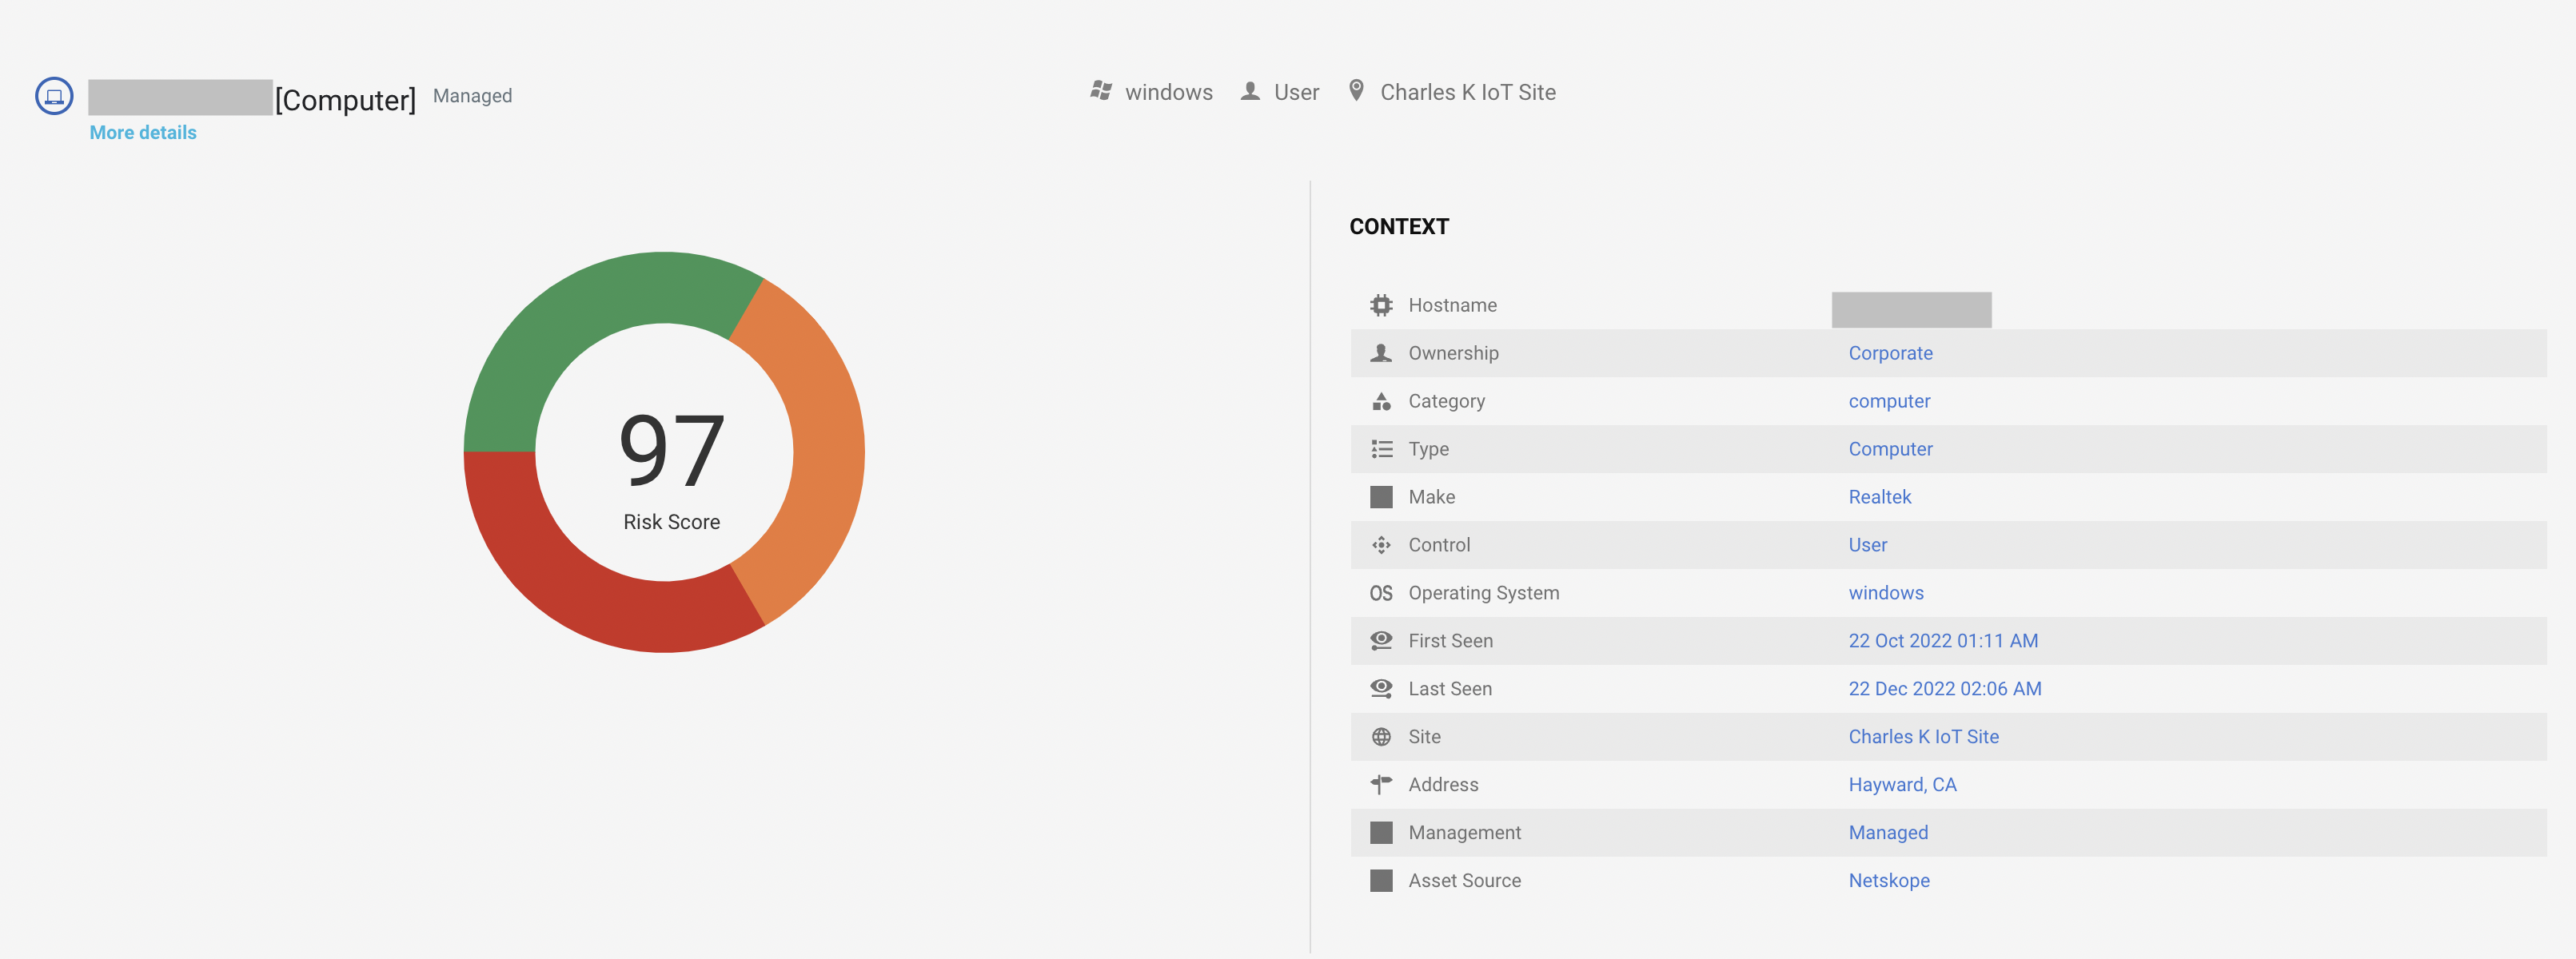 |
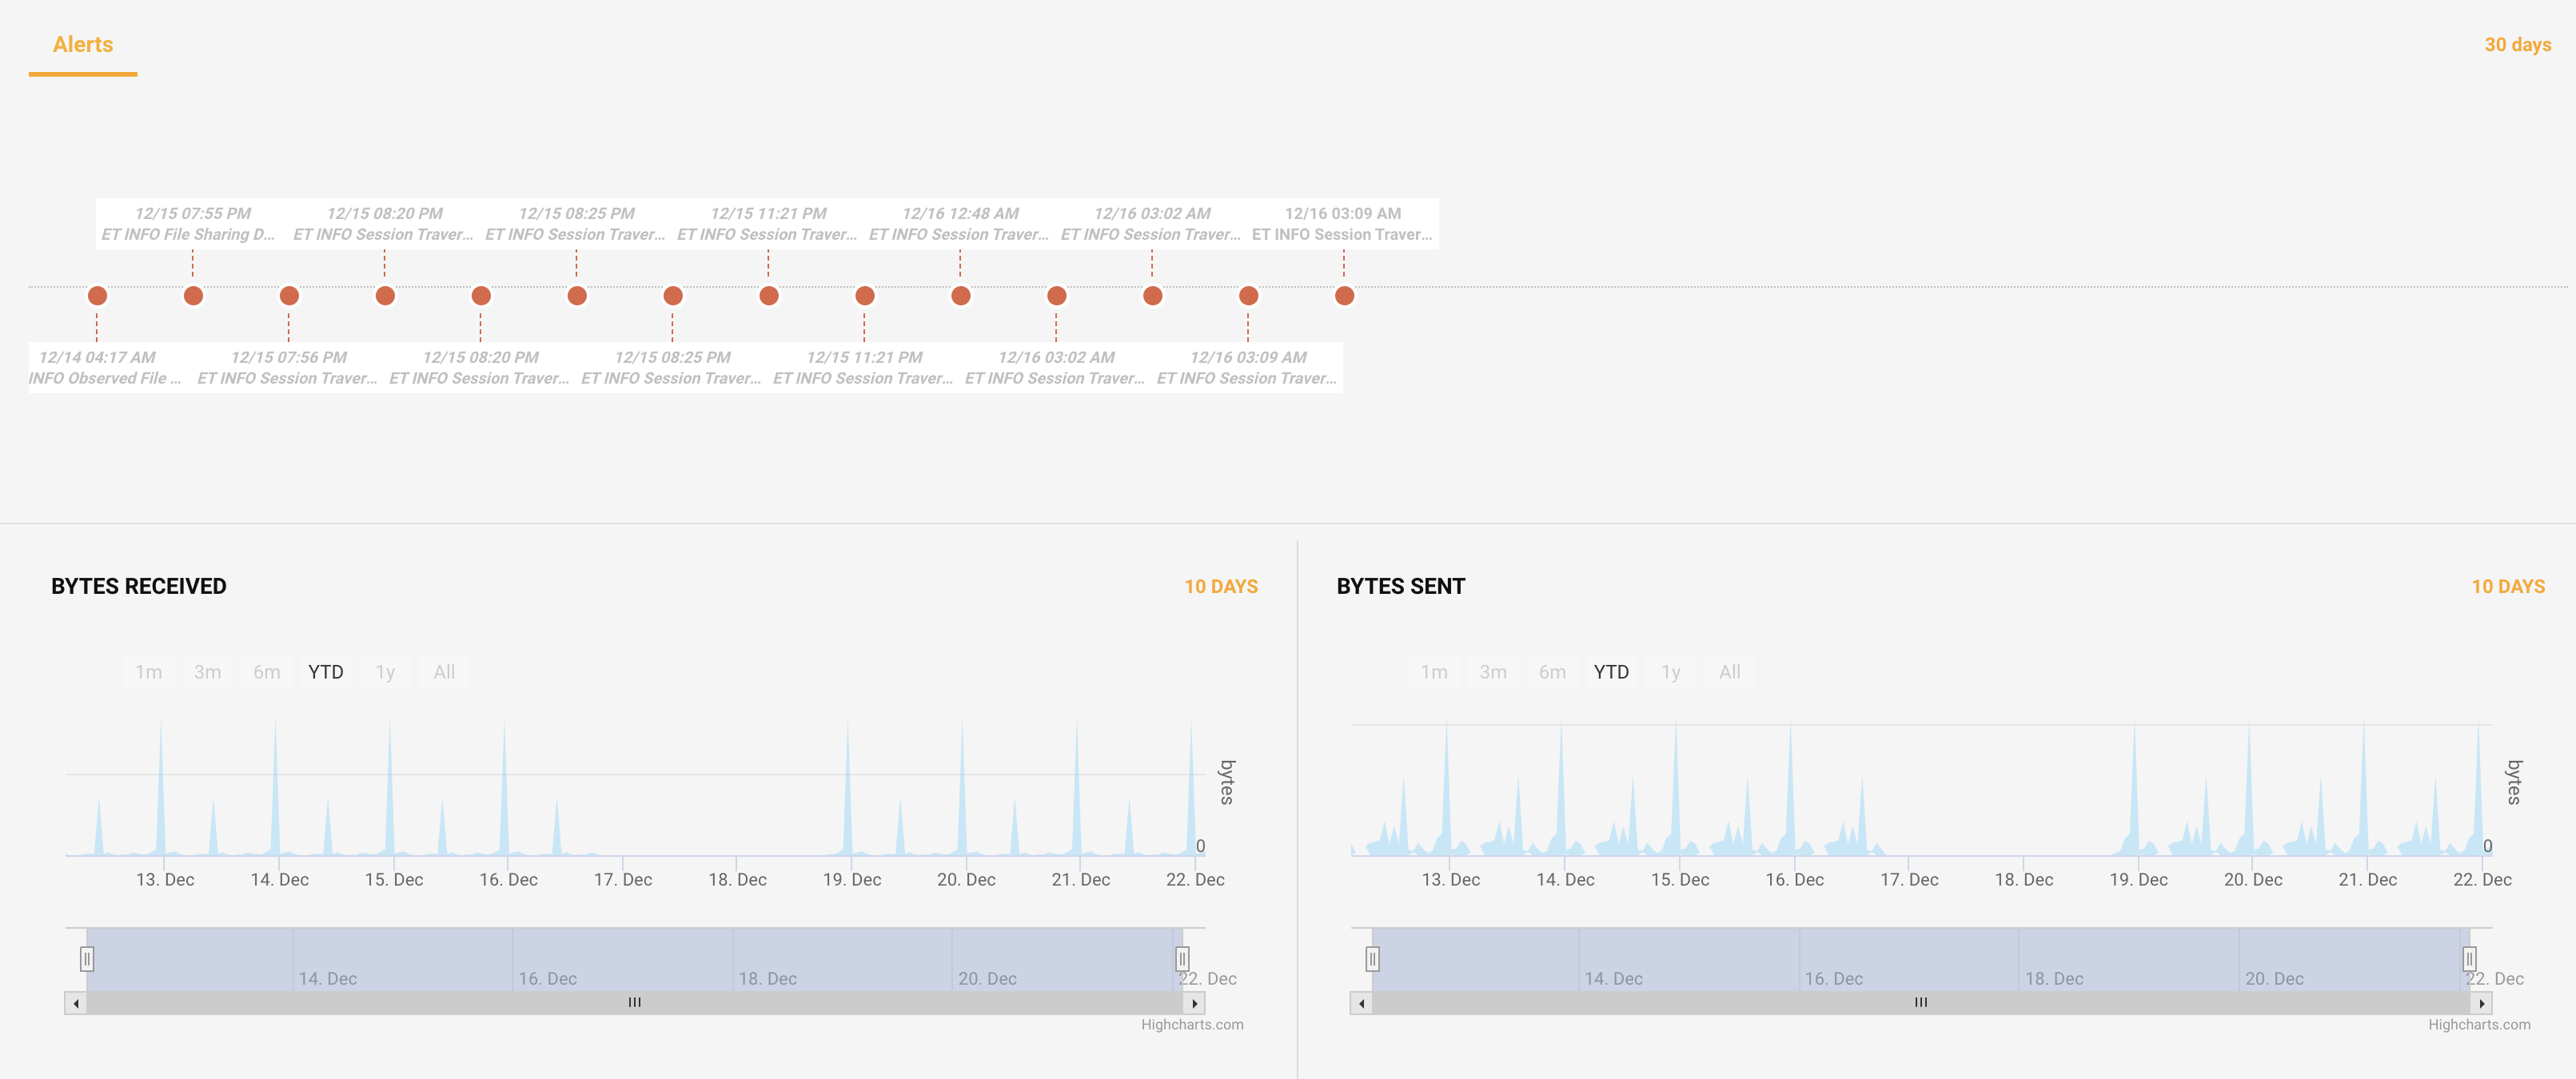
The screen shows a pie chart risk score and distinct risk contributions to the score of the device. You can see the drill down details of the device on the left side. Click on the More details link to see the alert and anomaly occurrences to raise a risk with the time of occurrence for the last 30 days to investigate the issue. You can also see the transfer of information in bytes received and bytes sent charts for the last 10 days.
 |
On the device risk summary page, you can see the device compliance with the asset management systems services. You can also see the interface connection on the left side.
 |
Drilling down, risk assessment shows the list of risk issues on the device with severity and number of occurrences.
 |
Investigate Compliance Services
The chart shows the compliance state of managed and unmanaged devices in the corporate environment with the total number of devices managed by that asset management system.
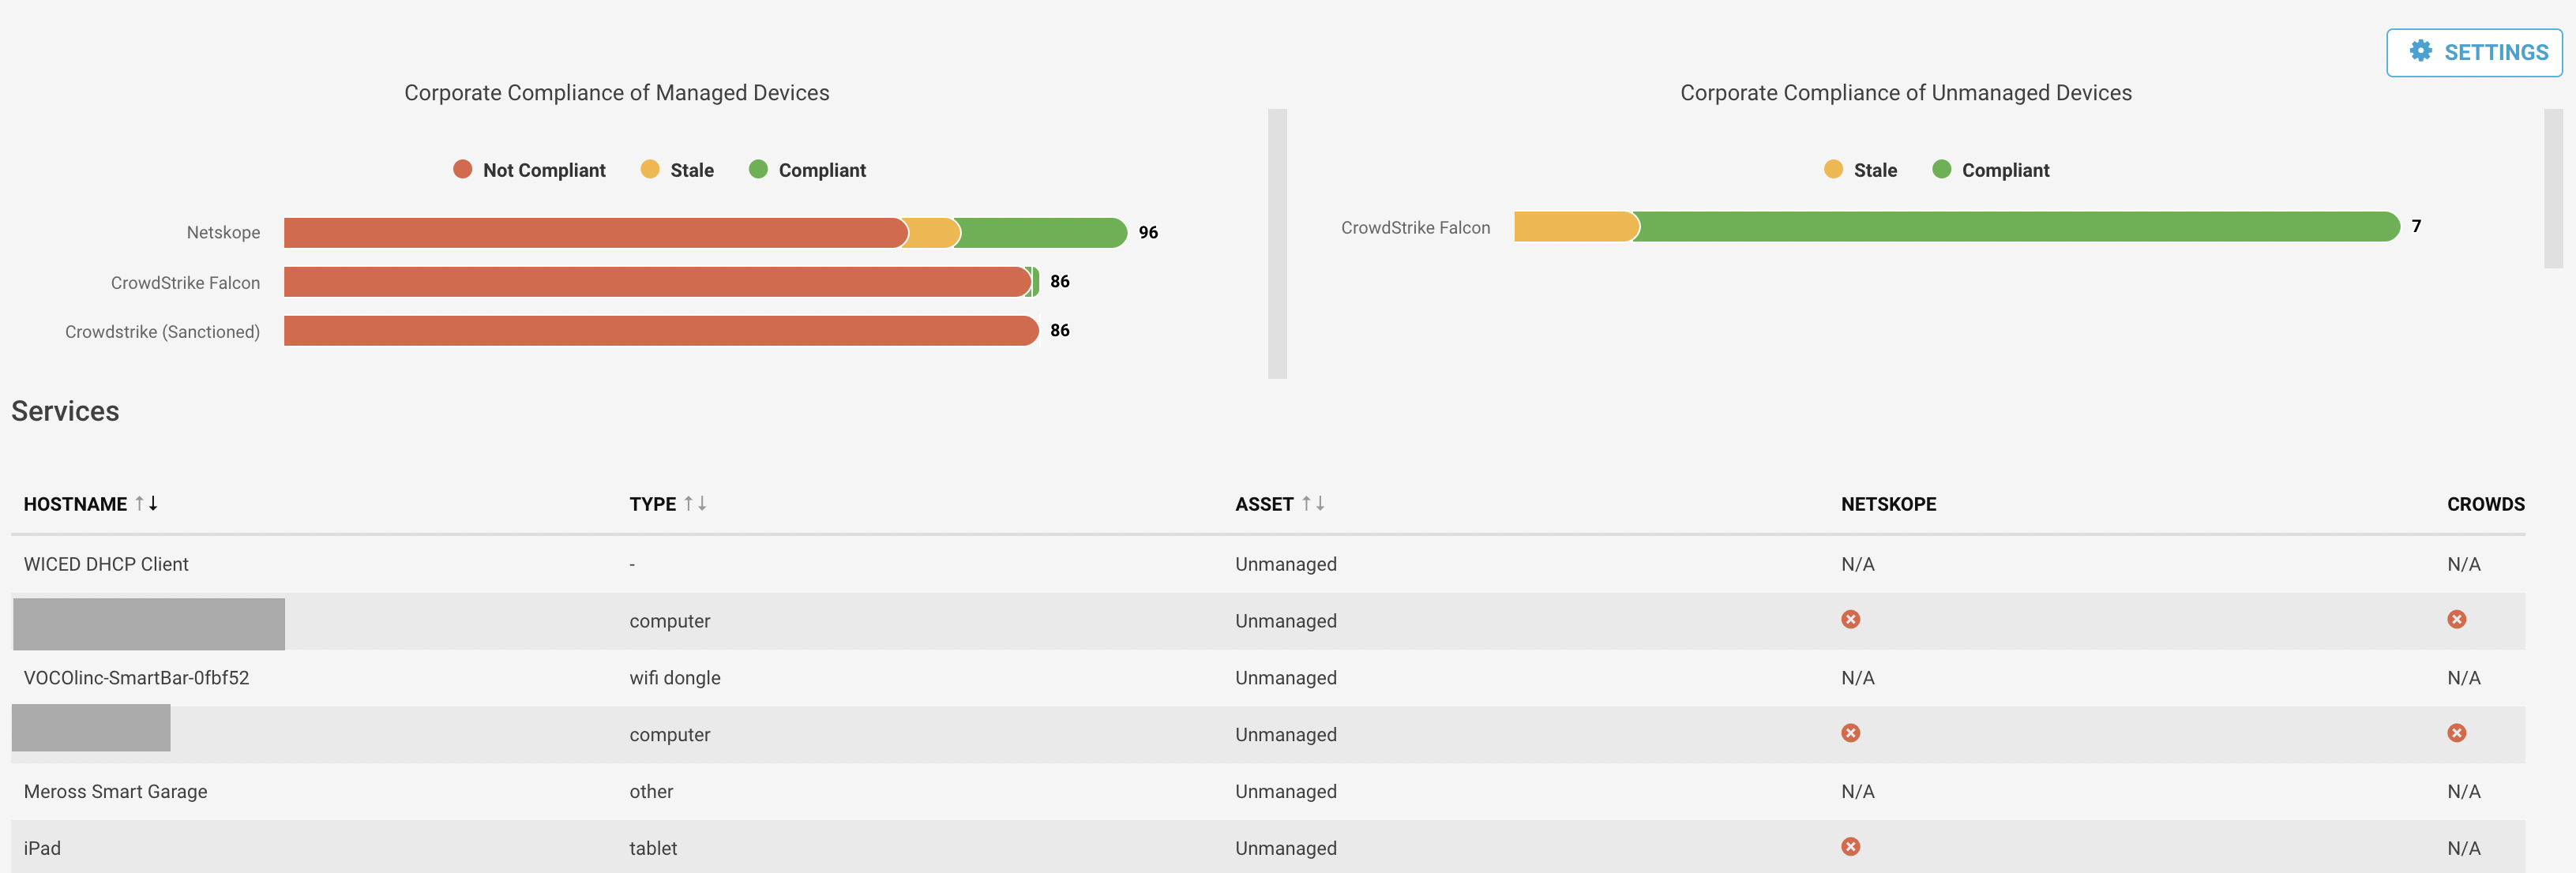 |
A device can be in compliant, non compliant or in a stale state. A device will be in a stale state when it does not have any movement for more than 15 days. You can configure the number of days. You can see the devices that do not follow the compliance in the table below the charts. The table shows the device host name, type, managed/unmanaged state and the services it is compliant and non-compliant. Click on the device host name to see a detailed device risk summary page.
Add a new Compliance Service
You can add a new compliance for the devices to follow in the environment. You can add a new compliance service based on either domain or integrated service. The system will attribute the compliance of a device. Follow the procedure to add a service:
Navigate to Investigate > Compliance menu.
Click Settings button on the top right corner of the screen.
Click on the Add new service button on the top right corner of the screen. You will see a new element to add a service at the bottom of the existing services.
Give a unique name to the service.
Give a description of the service.
Select the type of service. These types can be used to group compliance services based on the use of the services.
Management
App
Security
Give the maximum number of days to stale the device.
Select the control type.
User control
Automated control
Select the operating systems from the drop down list the service should follow.
Select the service integration type.
Domain based compliance - You can provide domains that are used by the service provider. Devices connecting to the domains will be considered as compliant.
Integration based compliance - You can provide API keys for the service provider. Netskope IoT Security backend integration service will pull devices from the service provider periodically and classify devices as compliant or non-compliant.

Modify Existing Compliance Service
You can edit or delete the existing service. Follow the procedure to edit the compliance service:
Navigate to Investigate > Compliance menu.
Click on the Settings button on the right top corner of the screen.
Choose a service you want to edit.
You can edit the name, description, type, date of stale, control, operating systems fields.
Click Save button
Note
Click the Delete button to delete the selected service.