About Malware
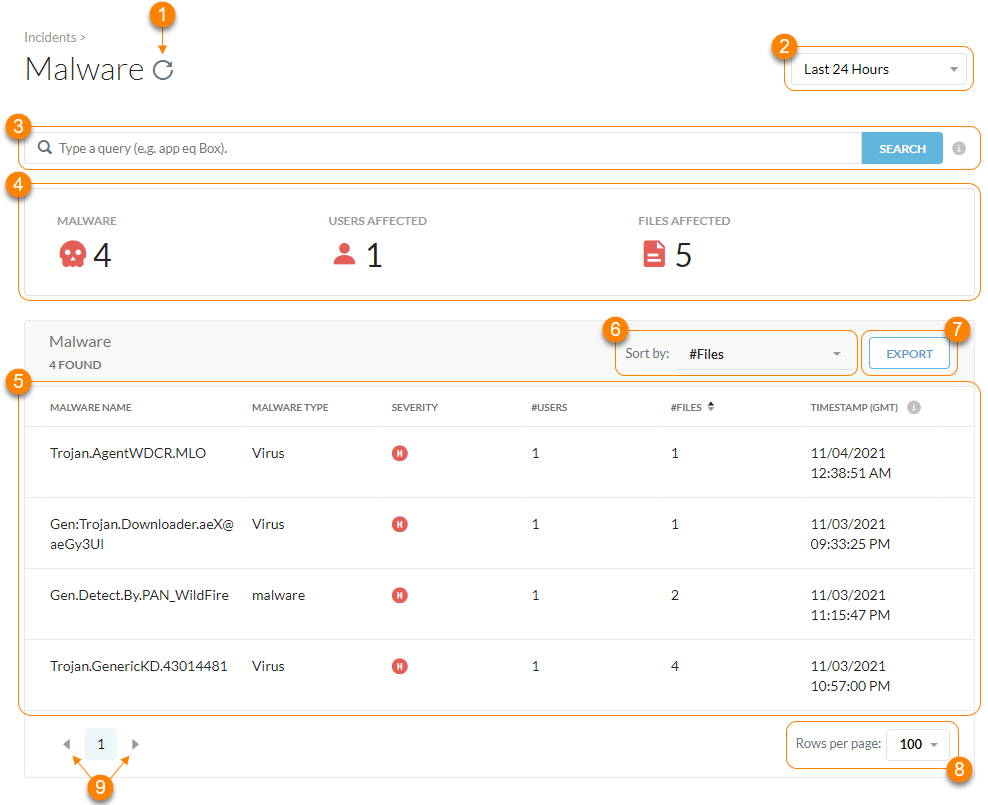
To view files affected by malware in your organization, go to Incidents > Malware.
On the Malware page, you can:
Refresh the malware incident results.
Filter malware incidents by a specific time frame. You can use a predefined time frame or choose Date Range to use the calendar and time menus to customize your own.
Search and filter the malware incidents by a query.
View the primary metrics of the malware incidents:
Malware: The total number of malware detected by the scan.
Users Affected: The total number of users whose files were affected by malware.
Files Affected: The total number of files quarantined or that triggered an alert.
View a list of malware incidents. For each incident, you can see the following information:
Malware Name: The name of the detected malware. Click to view malware details.
Malware Type: The type of malware detected such as a virus, trojan, custom profile hit, etc. To learn more: Malware Severity Levels and Detection Types.
Severity: The severity level Netskope assigned to the malware. The severity categories are:
High: Viruses
Medium: Spyware
Low: Other malware
To learn more: Malware Severity Levels and Detection Types.
#Users: The number of users affected by the malware.
#Files: The number of files affected by the malware.
Last Detection Time (GMT): The last time Netskope detected the file and took action based on your quarantine profile.
Sort the table by the above information.
Export all malware incidents (up to 500,000 rows) to a CSV file.
View up to 100 malware incidents per page.
View multiple pages of the table.
 |
Viewing Malware Details
On the Malware page, you can click the Malware Name to see more comprehensive details.
 |
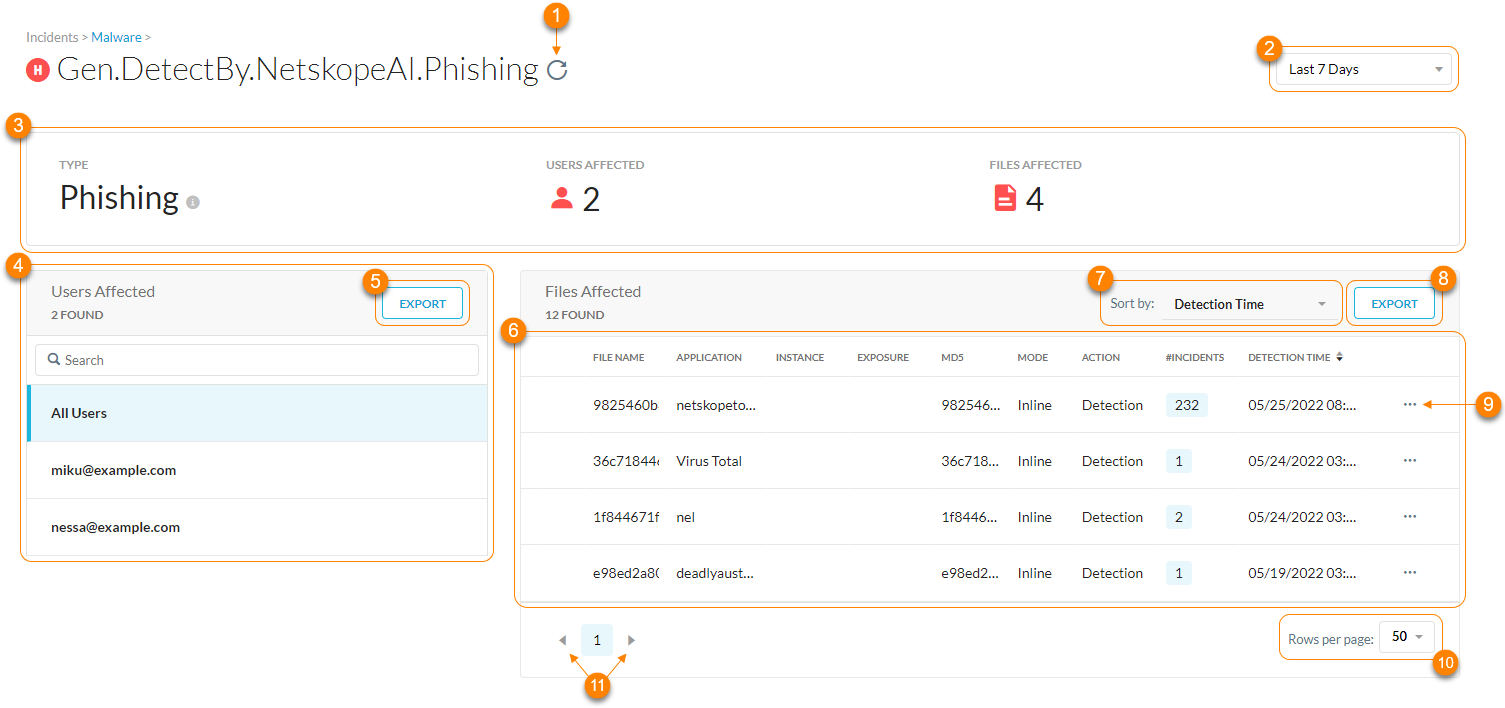
On the Malware Details page, you can:
Refresh the malware incident results.
Filter malware incidents by a specific time frame. You can use a predefined time frame or choose Date Range to use the calendar and time menus to customize your own.
View the primary metrics related to malware incident:
Type: The type of malware detected such as a virus, custom hash hit, etc. You can click
 for a short description.
Users Affected: The total number of users whose files were affected by the malware.
Files Affected: The total number of files quarantined or that triggered an alert.
View a list of the users affected by the malware. You can filter the Files Affected list by all users or a specific one. You also can search for a specific user.
Export a list of affected users (up to 500,000 rows) to a CSV file.
View a list of files affected by the malware. For each file, you can see the following information:
File Name: The name of the infected file. Click to view the file details.
Application: The application associated with the file and affected by the malware.
Instance: The name of the Netskope tenant.
Exposure: The file sharing settings of the infected file, which are controlled in the application. The settings include:
Private
Internally Shared
Externally Shared
Public
MD5: The MD5 hash calculated from the file during detection. You can use this hash value to confirm that the file you have downloaded is the same file that was scanned. You can use this if there is a discrepancy or for an internal incident response plan.
Mode: The type of Netskope policies that detected the infected file.
Inline: The real-time protection policies detected the file.
Introspection: The API data protection policies detected the file.
Action: The action taken on the infected file based on your configured quarantine profile.
Detection: Netskope detected the file and sent an alert.
Quarantine: Netskope detected the file and quarantined it.
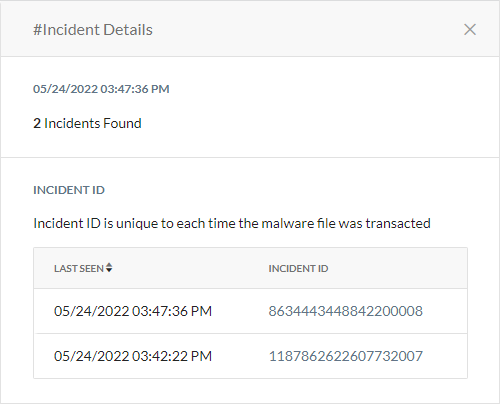
#Incidents: The number of incidents caused by the infected file. Click to see the following information:
Last Seen: The time the incident occurred with the infected file. For each new incident, Netskope creates a new timestamp and incident ID.
Incident ID: The unique ID for each time Netskope sees the infected file. Click to go to Skope IT Alerts and see all the transactions associated with the incident ID and MD5 of the infected file.

Note
Incident information is only available for Inline mode. For Introspection mode, the column always displays zero incidents.
Detection Time: The time Netskope detected the file.
Sort the table by the above information.
Export a list of affected files (up to 500,000 rows) to a CSV file.
Click
 to choose one of the following options:
Quarantine: Click to choose a quarantine profile and quarantine the infected file. This option only appears if the infected file triggered an alert.
Restore: Click to restore the infected file. This option only appears if the infected file was quarantined.
Download: Click to download the malicious file sample as a password-protected ZIP file. You can go to Settings > Threat Protection > API-enabled Protection to get the ZIP password. This option only applies to API Data Protection.
Add to File Profile: Click to add the file hash to a file profile, which you can use to allow or block the file. Allowlists and blocklists are supported for real-time protection only.
View Alerts: Click to go to Skope IT Alerts and see all the malware detection alerts associated with the MD5 of the infected file.
View up to 100 affected files per page.
View multiple pages of the table.
 |
Viewing File Details
On the Malware Details page, you can click the file name to see an in depth analysis.
 |
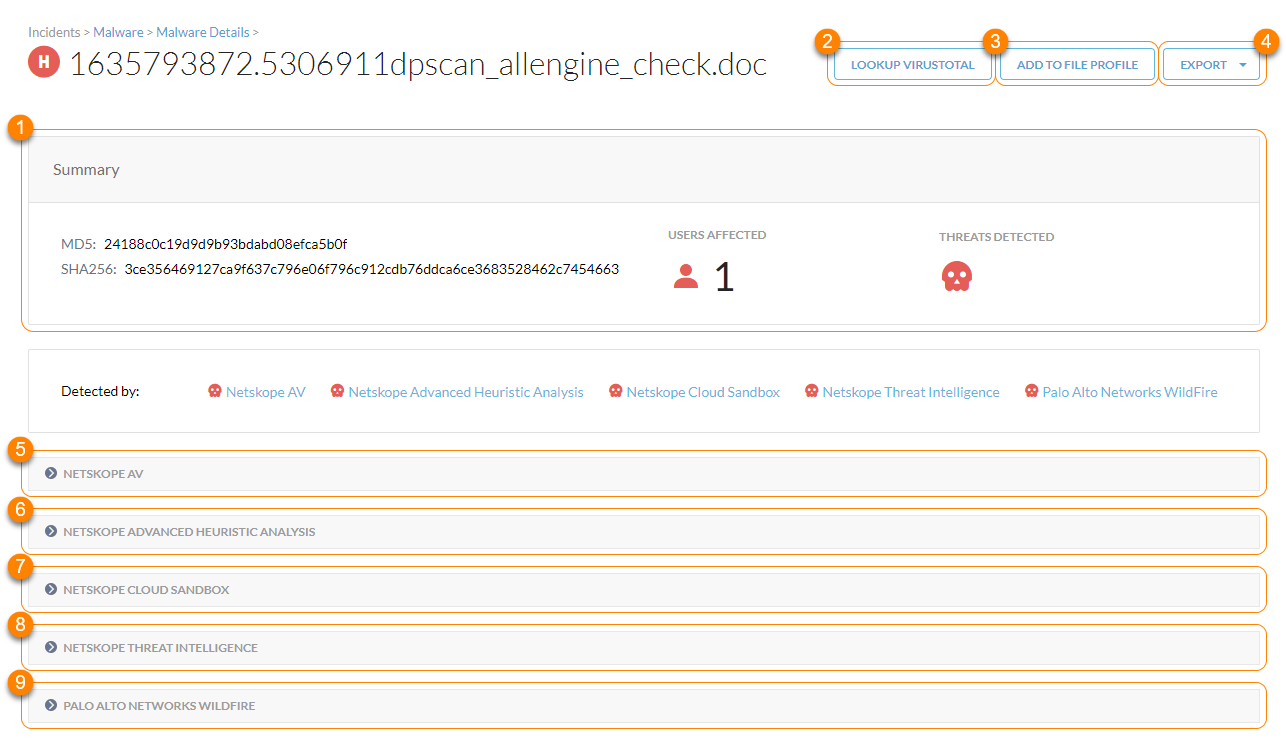
On the File Details page, you can:
View summarized information on the infected file:
MD5: The MD5 hash value of the file. You can use it to validate data integrity. Click to copy it to your clipboard.
SHA256: The SHA-256 hash value of the file. You can use it to find identical files. Click to copy it to your clipboard.
Users Affected: The total number of users affected by the file.
Threats Detected: The type of threat detected.
Look up more malware information on VirusTotal, a third-party aggregator of malware information. VirusTotal is a complementary source of information and might not have details on all malware especially in documents that are private to your ogranization.
Add the file hash to a file profile that allows or blocks the infected file. You can use this option to add an infected file to an allowlist so it's exempted from the analytics engine.
Export the infected file details as a STIX report (.xml) or PCAP file (.pcap).
View Netskope AV signature matching for the infected file.
View advanced heuristics analysis for the infected file.
View cloud sandbox analysis for the infected file.
View file analysis from Netskope Threat Intelligence. Netskope's curated threat intelligence includes indicators of compromise (IOCs) gleaned from detections discovered by advanced scanning engines in the Netskope cloud.
View file analysis from an integrated third-party threat detection engine, such as Palo Alto Networks Wildfire, Juniper SkyATP, and Check Point SandBlast. To learn more: Advanced Threat Protection. Click Download Analysis Result to download the results as a PDF file.
 |