Advanced Analytics Incidents
Admins can leverage Advanced Analytics (AA) Incidents for deeper investigative analysis to measure security improvements.
USE CASES
Use Case | Description |
|---|---|
Visibility into DLP incidents resolution progress | Incident managers are able to get a clear picture of where the mitigation/resolution lifecycle incidents are and easily identify bottlenecks in the process. |
Tracking the resolution time for DLP incidents |
|
General incident management for all other types of incidents (e.g. Malware, Malsite, UEBA, Compromised Credentials) |
|
DLP INCIDENTS STATUS MONITORING DASHBOARDS
There are several default dashboards available for admins to use or modify and save in your personal folder.
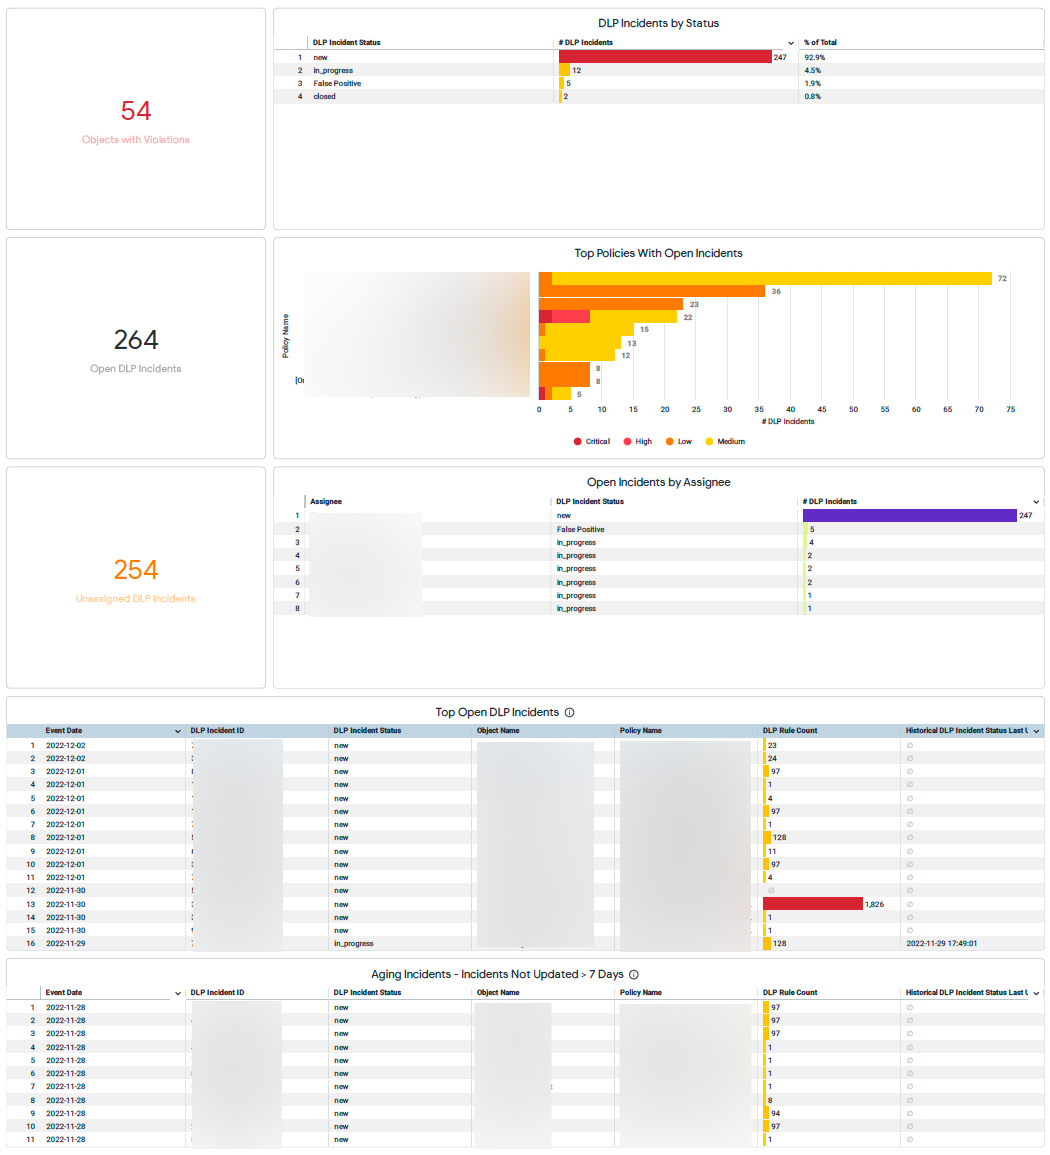
Open and Outstanding Incidents
Results for this dashboard are based on incidents with the "Closed" or "Resolved" statuses. Admins can adjust the dashboard filter for custom-defined statuses. The 'last status update time' can be adjusted through the dashboard level filter called "Historical DLP Status Update Time".
DLP Incidents by Status - lists DLP incident status, number of incidents, and percent of total incidents
Top Policies with Open Incidents - lists the policy name, number of DLP incidents, and severity (Critical, High, Low, Medium)
Open Incidents by Assignee - lists the assignee (user email), DLP incident status, and number of DLP incidents for the assignee
Top Open DLP Incidents - lists the date of incident, incident unique ID number, DLP Incident status, object name, policy name, DLP rule count, and historical DLP incident status last used. The 'last status update time' can be adjusted through the dashboard level filter called "Historical DLP Status Update Time".
Aging Incidents (incidents that have not been updated in more than seven days) - lists the date of incident, incident unique ID number, DLP Incident status, object name, policy name, DLP rule count, and historical DLP incident status last used. The 'last status update time' can be adjusted through the dashboard level filter called "Historical DLP Status Update Time".

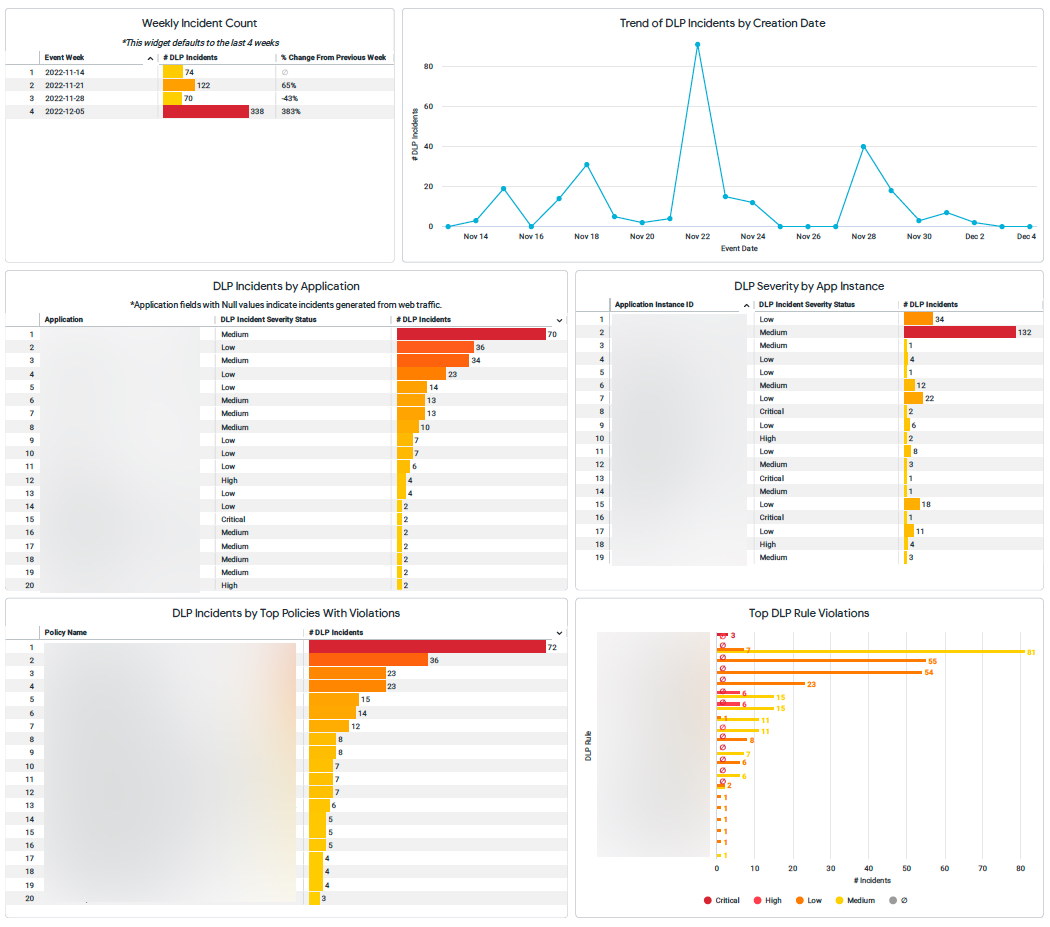
Incidents Created
The 'DLP Incident creation date' is based on the "Event Date" dashboard level filter.
Weekly Incident Count (this widget defaults to the last four weeks) - list the week of the incident in date format, number of DLP incidents, and the percentage the incident changed from the previous week
Trend of DLP Incidents by Creation Date - lists the number of DLP incidents and the incident date
DLP Incidents by Application (applications fields with null values indicate incidents generated from web traffic) - lists the application name, severity status, and number of DLP incidents
DLP Severity by App Instance - lists the application instance ID, severity status, and number of DLP incidents
DLP Incidents by Top Policies with Violations - lists the policy name and number of DLP incidents
Top DLP Rule Violations - lists the DLP rule name, number of incidents, and severity (Critical, High, Low, Medium, Null)

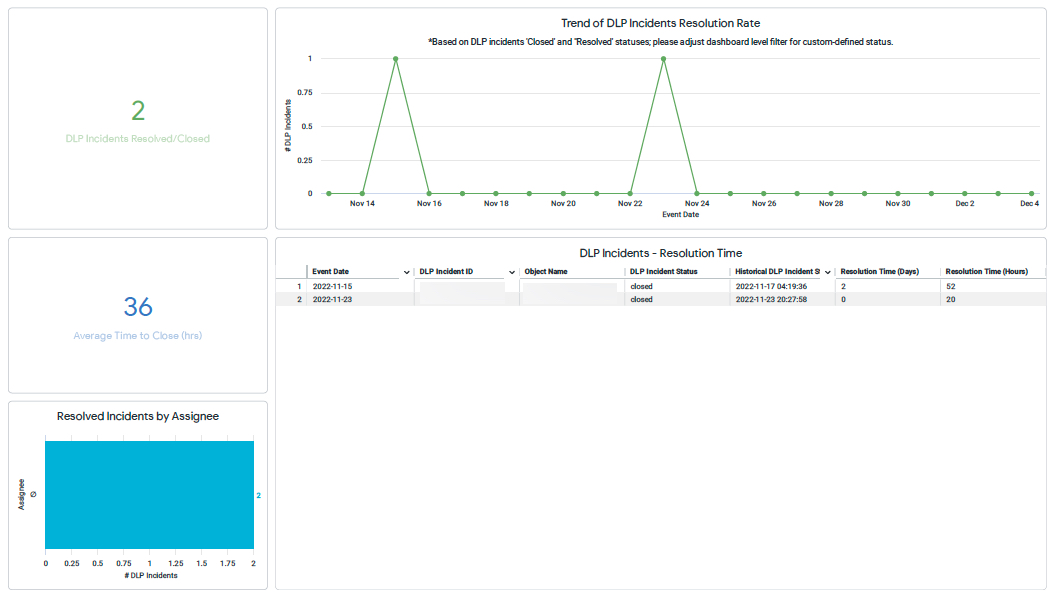
Incident Resolution
Results for this dashboard are based on incidents with the "Closed" or "Resolved" statuses. Admins can adjust the dashboard filter for custom-defined statuses.
DLP Incidents Resolved / Closed - displays the total number of incidents that are in the resolved / closed status.
Average Time to Close - displays the average number of hours to resolve / close incidents
Resolved Incidents by Assignee - lists the assignee email and number of DLP incidents they resolved / closed
Trend of DLP Incidents Resolution Rate - lists the number of DLP incidents and the incident date
DLP Incidents Resolution Time - lists the incident date, DLP incident ID, object name, status, historical DLP incident status date, number of days it took to resolve / close the incident, and the number of hours it took to resolve / close the incident
