Cloud Firewall Network Events and Alerts
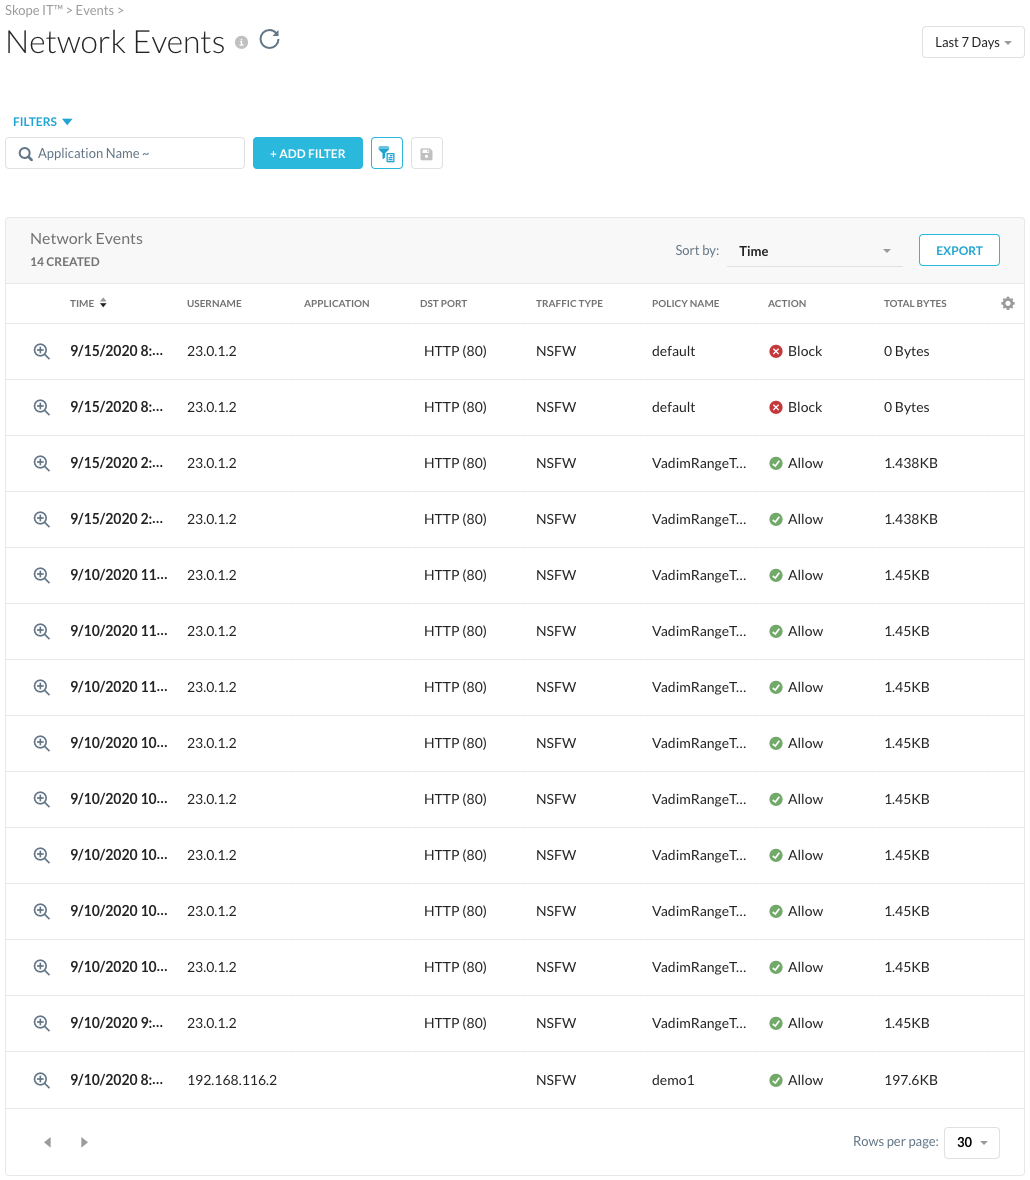
Network Events log all traffic that is steered to Netskope at the connection level.
To view Network events, go to Skope IT > Events > Network Events.
Note
For all traffic except HTTP(s), system logs once when the session is established and logs again when the session closes. For HTTP(s) traffic, system only logs when the session closes.
The default Network Events page table includes:
Time: The day and hour the event occurred
Username: email address of the user that caused the alert
Application: The application specified, if any, in the Real-Time Protection policy
DST Port: User's destination port
Traffic Type: NSFW which stands for Netskope Firewall (NOTE: Traffic Type is not visible by default. Click the
 icon to open the Customize Columns window and add it to the table view).
Policy Name: The name of the Real-Time Protection policy
Action: The action specified in the Real-Time Protection policy
Total Bytes: Total Bytes transferred using the traffic flow (Total Bytes = Bytes Uploaded by User + Bytes Downloaded from Server)
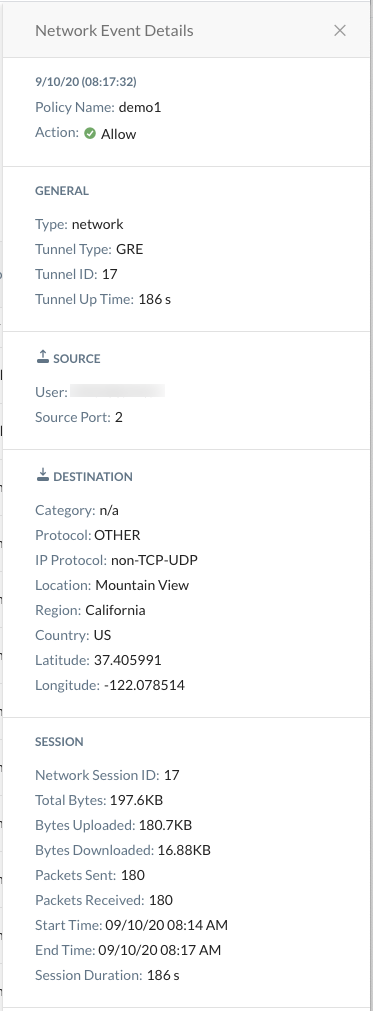
To view detailed information about a network event, click the  icon.
icon.
Other page components include:
Refresh Page button: To update the page with the most current information, click the Refresh icon next to the page title.

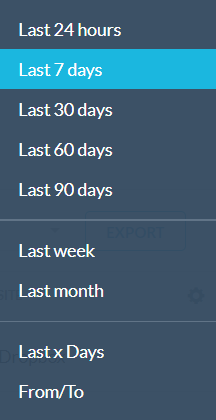
Date Range list: In the top right corner of the page is a date range filter. Click the toggle and select one of these date ranges.
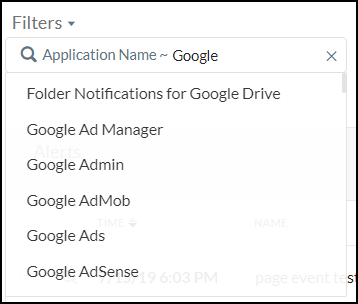
Application Name search filter: This search field helps you find applications and then filter results. Enter a name and then select from the list.
You can filter a field by null value. Operators like = and != will work for filtering by null.
Add Filter lists: To create a filter, click + Add Filter, select what to include what to find in the search, and then click Apply.
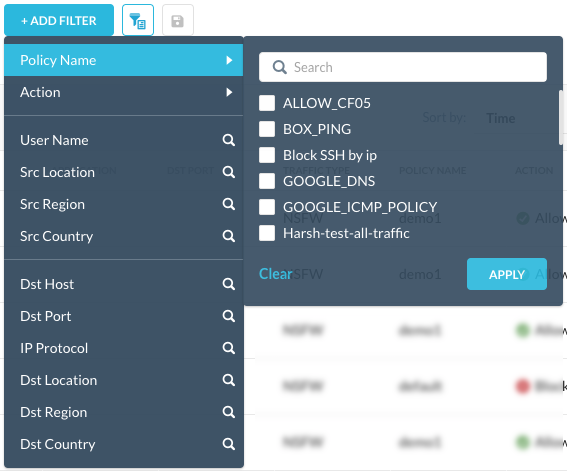
Tip
You can choose multiple items for some options. The options with the  icon allows you to search.
Query Mode button: Optionally, switch to query mode  and enter a query in the search field. For example, to specify firewall traffic type events, enter the following query.
traffic_type eq NSFW
To change back to the filter view, click Filter Mode.

Save Filter button: After adding a filter, you can save it for future searches by clicking Save Filter.

Sort by: Time, Total Bytes, Bytes Uploaded, Bytes Downloaded. This sorts the table columns.
Export button: Click Export to get the entire list of network events. First select the columns to export (those displayed, or specify which columns), and the number of rows, then click Export again. Your column and row selections are retained for future exports.
The system sends an email with a link that allows you to download the list in CSV format.
Rows per page list: At the bottom right corner of the page, the Rows per page list allows you to display 10, 20, 30, 50, or 100 rows per page.
Customize Columns
Use the Customize Columns dialog box to specify the information you want to see. Click the gear icon  located at the far right of the table column header row, and then select the columns you want to see.
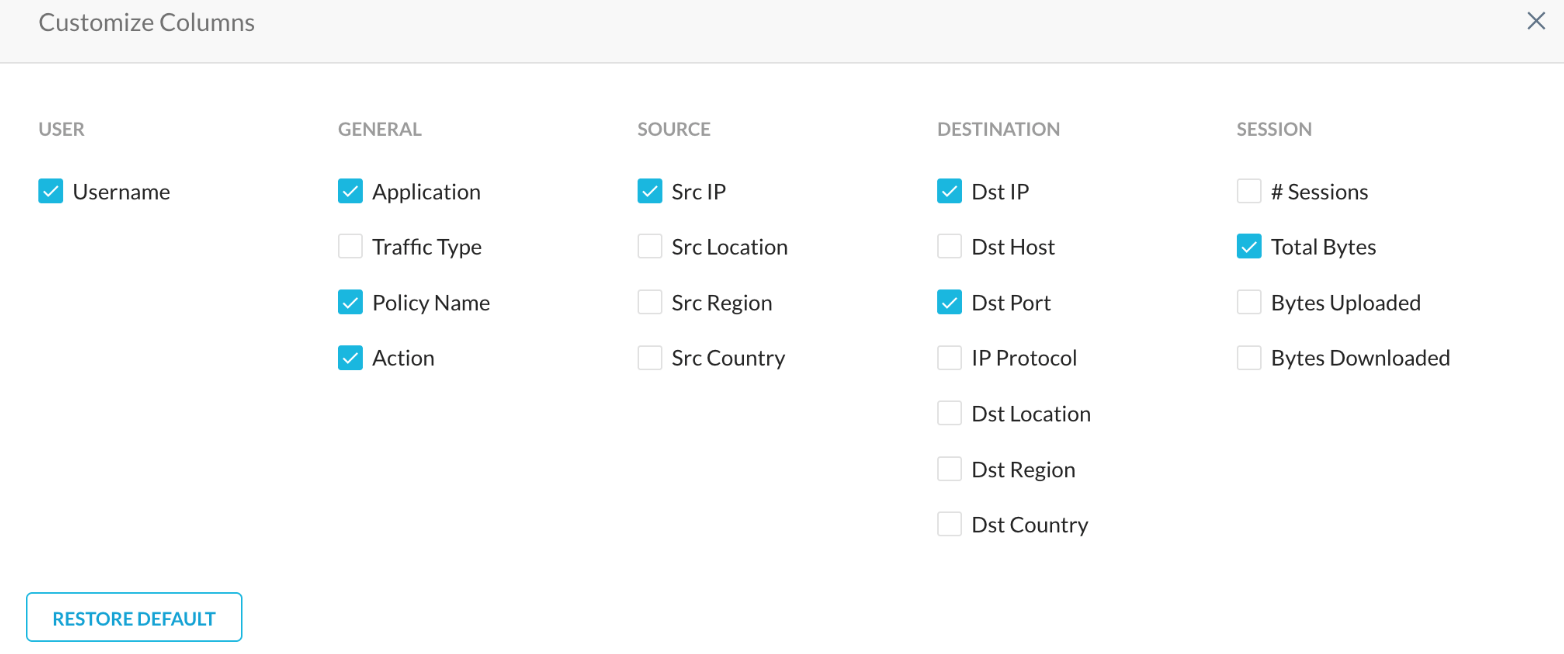
Source: includes Username, Source Location, Source Region, Source Country
General: includes Application, Traffic Type, Policy Name, Action
Destination: includes Destination Host, Destination Port, IP Protocol, Destination Location, Destination Region, Destination Country
Session: includes Number of Sessions, Total Bytes, Bytes Uploaded, Bytes Downloaded
Click Restore Defaults to restore column-related default settings.
Cloud Firewall Alerts
Firewall alerts are logged if traffic is blocked by the explicit firewall rule. Alerts display in the list page. Admins must review and acknowledge the event and take additional action as needed.
To view Network events, go to Skope IT > Events .
The page components are similar to the Network Events. However, the main difference is the  button.
To remove an alert from this page, enable the check boxes beside one or more alerts, click Acknowledge, and then choose Selected Alerts or All Alerts. Acknowledging the alerts will remove them from this list.