Tenant Overview
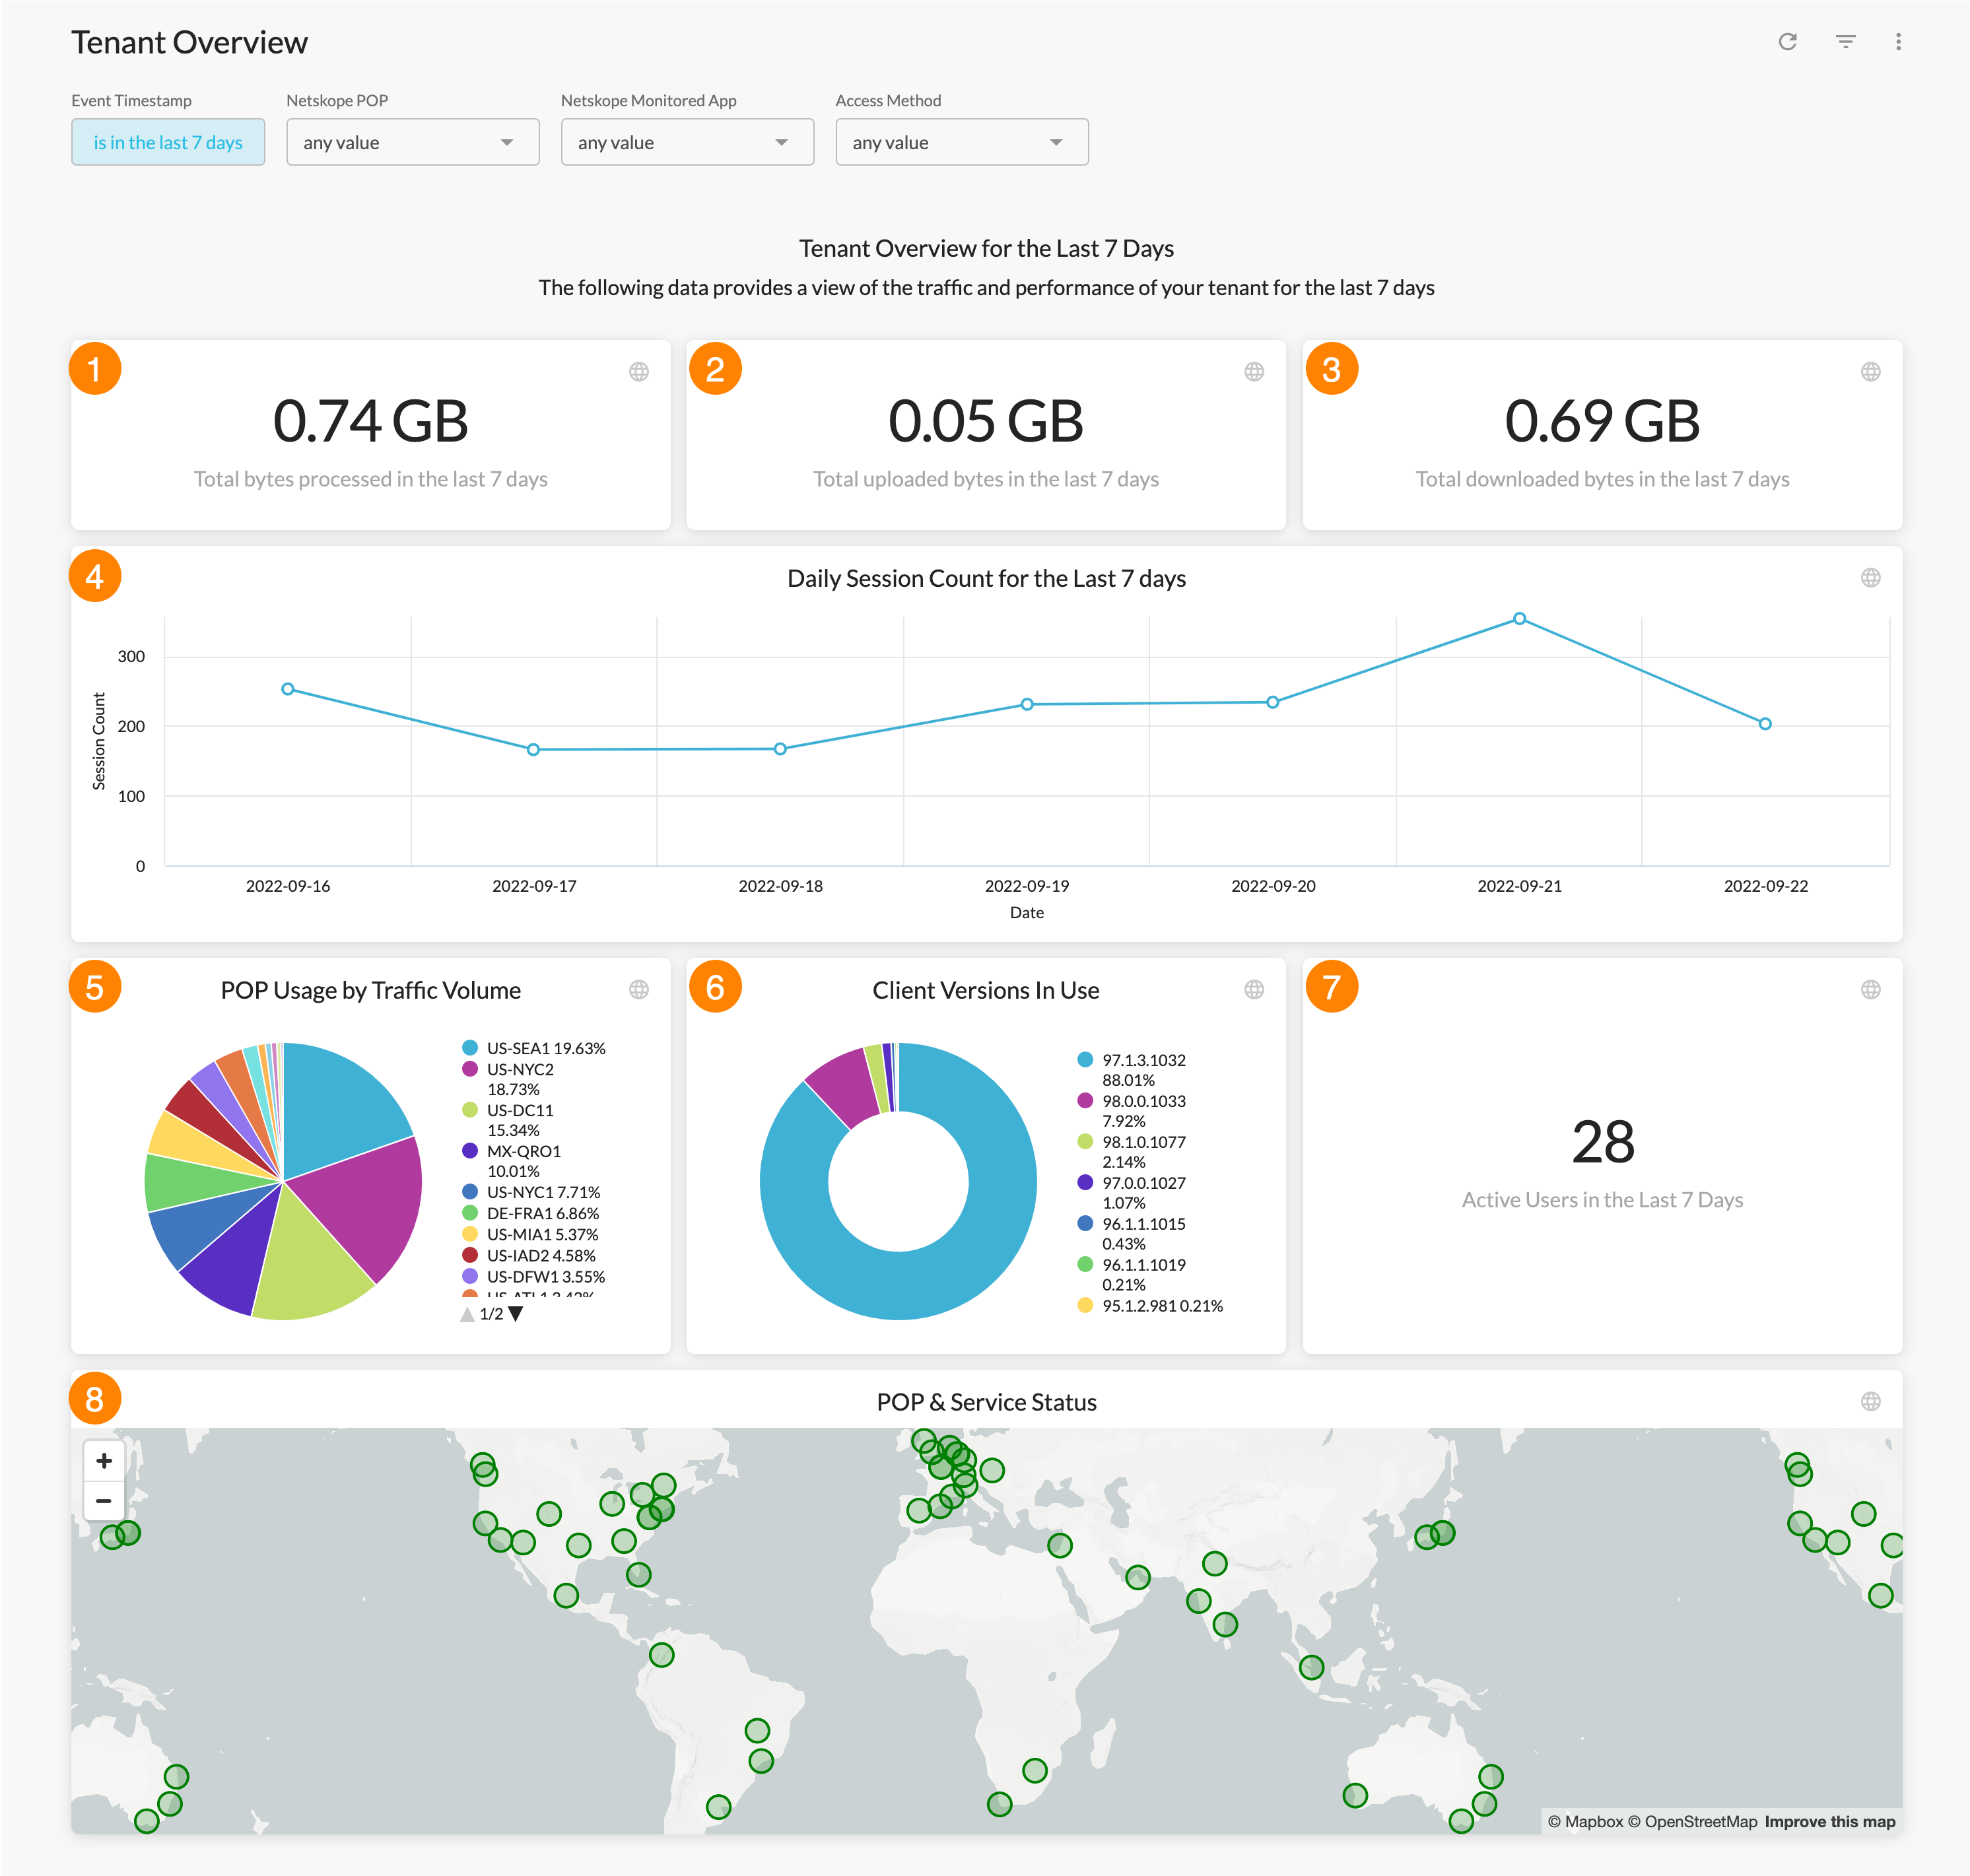
The widgets on this page provide an overview of the traffic and performance of your tenant. There are two sets of widgets on this page. The top section provides a summary of the last 7 days and cannot be filtered. The Filtered Widgets section provides information based on the timeframe you select using the filters on top of the page.
Usage and Session Count
The top section of the page displays information about the data usage, session counts, Netskope POPs in use, Netskope Client versions in use, and number of active users.

Total bytes processed in the last 7 days: The total number of bytes processed by Netskope in the last 7 days.
Total uploaded bytes in the last 7 days: The total number of bytes uploaded by users in the last 7 days.
Total downloaded bytes in the last 7 days: The total number of bytes downloaded by users in the last 7 days.
Daily Session Count for the Last 7 days: The daily session count for all access methods in the last 7 days.
POP Usage by Traffic Volume: The total usage for all access methods distributed by the POP.
Client Versions In Use: The total number of sessions with a specific client version in the last 7 days.
Active Users in the Last 7 Days: The number of active users in the last 7 days.
POP & Service Status: The POP & Service Status map shows you all of the Netskope POPs used by the tenant in the last 90 days, along with the near real-time status of all services in each POP.

Click on a green circle to view the status details of all your services.
The timeframe on these widgets is preset to show data for the last 7 days. Changing the Event Timestamp filter on top of the page does not affect the timeframe on these widgets.
Use the filters on top of the page to view data for a specific timeframe, Netskope POP, Netskope Monitored app, or Access Method under Filtered Widgets. The Access Method filter can only be applied to “Hourly Traffic Volume By POP” and “Unique Active Users Per Hour By POP” widgets.
Filtered Widgets
The widgets provide a view of latency and data usage using graphs. You can use the filters on top of the page to select an event timestamp, Netskope POP, and applications for which you want to view the data.
The Client to Netskope POP Latency widget shows you the average round trip time between the end user's device and the Netskope POP. It does not account for the processing time in the client or in the POP.

Similarly, the Netskope POP to App Latency widget shows you the average round trip time observed between the Netskope POP and the destination application. It does not account for the Netskope platform's processing time.

The Uploaded & Downloaded Bytes shows you the average number of bytes that are uploaded and downloaded by the end users. This graph can help you identify peak durations of network traffic. Using this data, you can monitor your network traffic for sudden spikes, or manage your infrastructure maintenance window during off-peak hours.

The Hourly Traffic Volume By POP shows you the total number bytes sent to a POP by the hour on that day. You can use the Access Method filter on top of the page to view data for a specific traffic steering method.

The Unique Active Users Per Hour By POP shows you the number of unique active users connected to a single POP by the hour on that day. You can use the Access Method filter on top of the page to view data for a specific traffic steering method.

The Storage Scan Consumption By Month shows you the volume of data scanned in GB per month for each of the Netskope supported public cloud resources.
