View Security Posture Overview
Netskope Next Generation SaaS Security Posture Management (SSPM) has introduced a brand new Overview page. The Overview page provides a summary of the following:
SaaS apps configured in Next Generation SSPM.
Note
The Applications widget now shows a summary of 3rd-party connected apps.
Total number of users across SaaS apps and the past 7 days trend graph.
Total number of findings which includes passed and failed rules and findings broken down by severity/apps, and past 7 days trend graph.
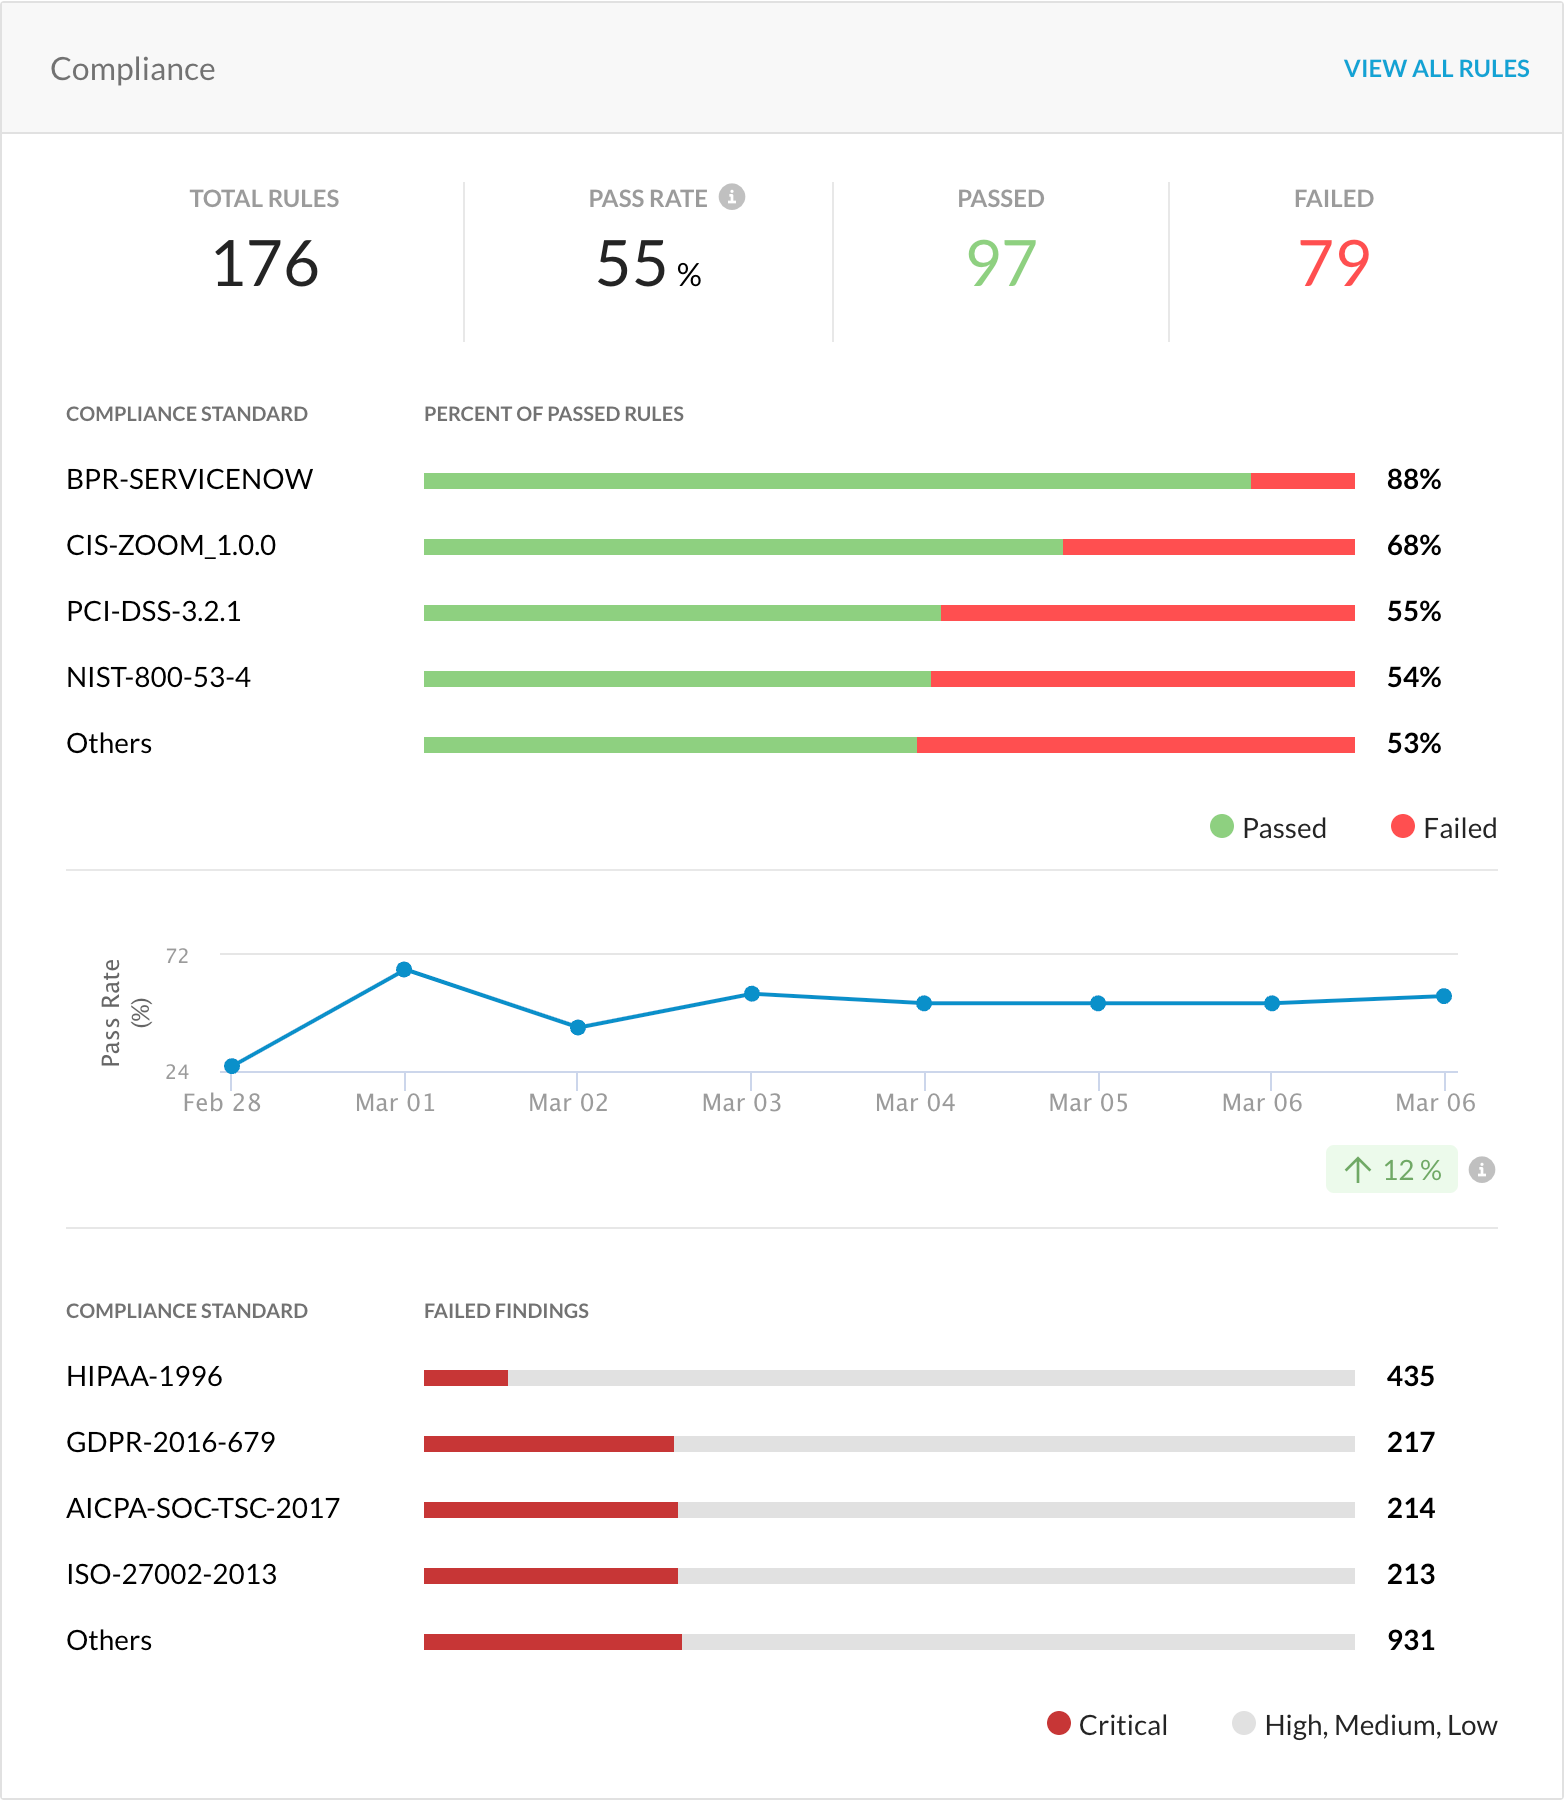
Compliance standard pass percentage, percentage of passed rules by compliance standard, past 7 days trend graph, and failed findings count by compliance standard.
To view the Overview page, log in to your Netskope tenant and navigate to API-enabled Protection > Security Posture (Next Gen) > Overview.
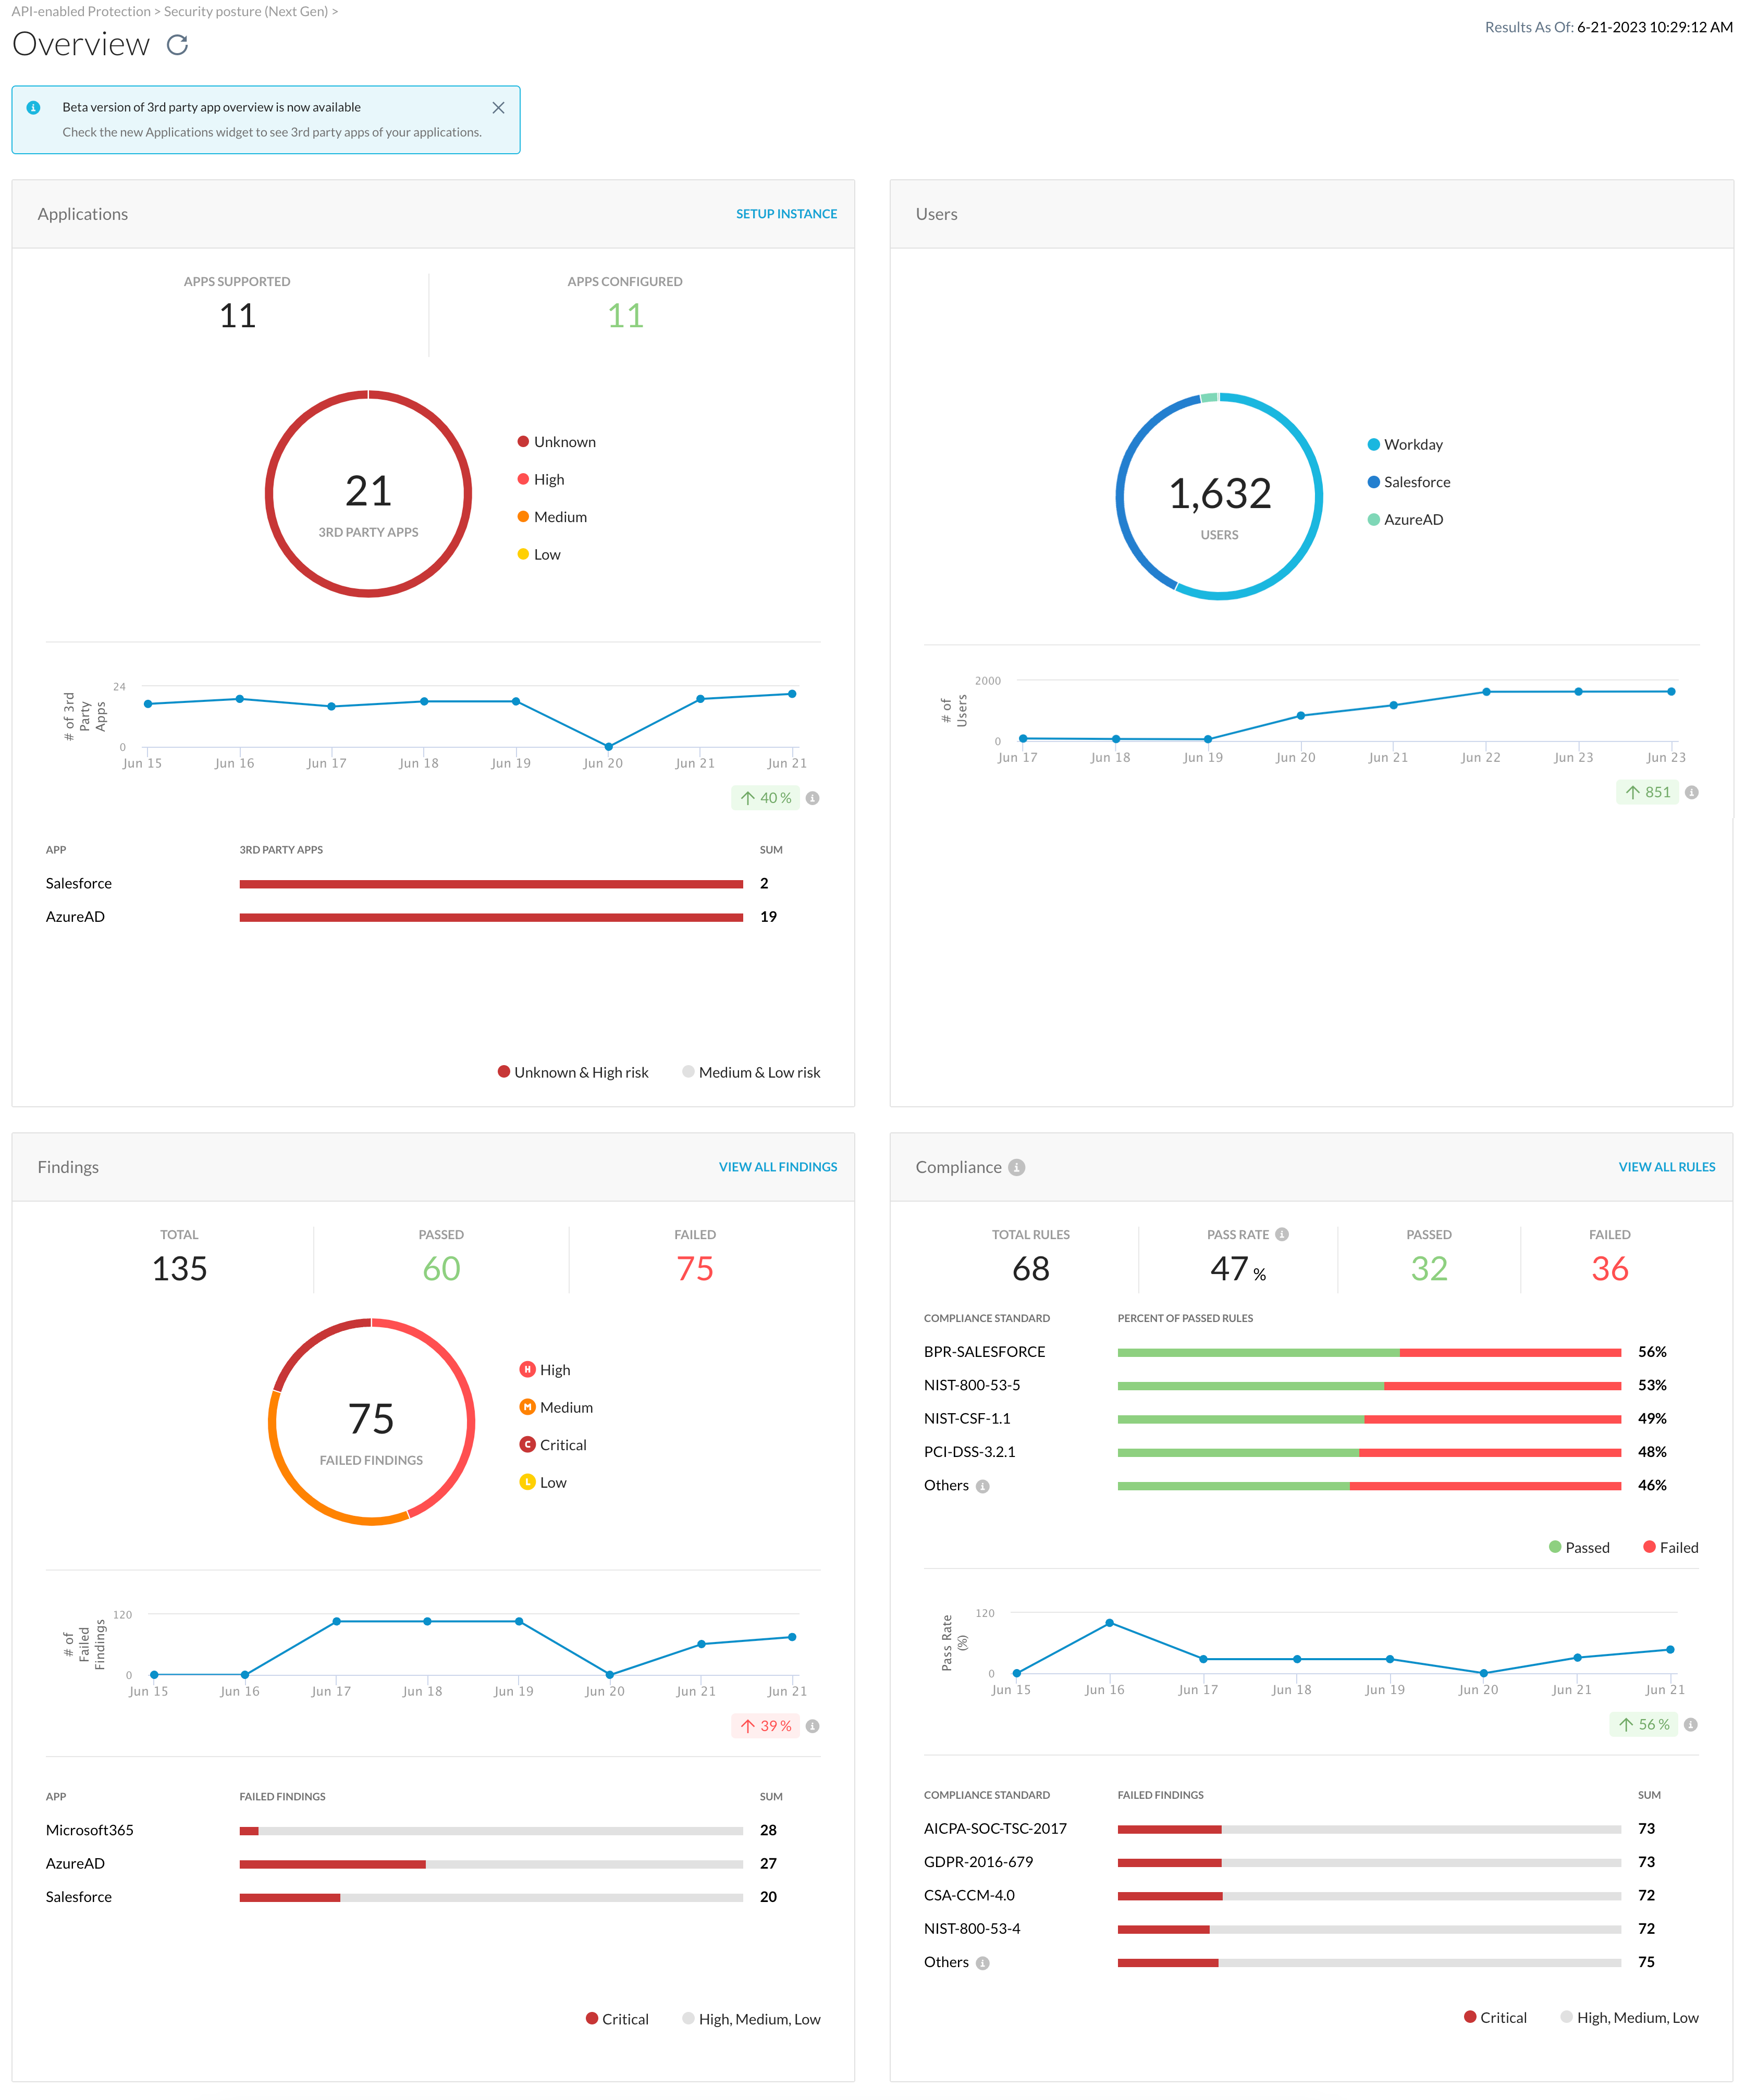 |
You can refresh the page and the Result As Of label shows the date and local time.
There are 4 widgets on this page:
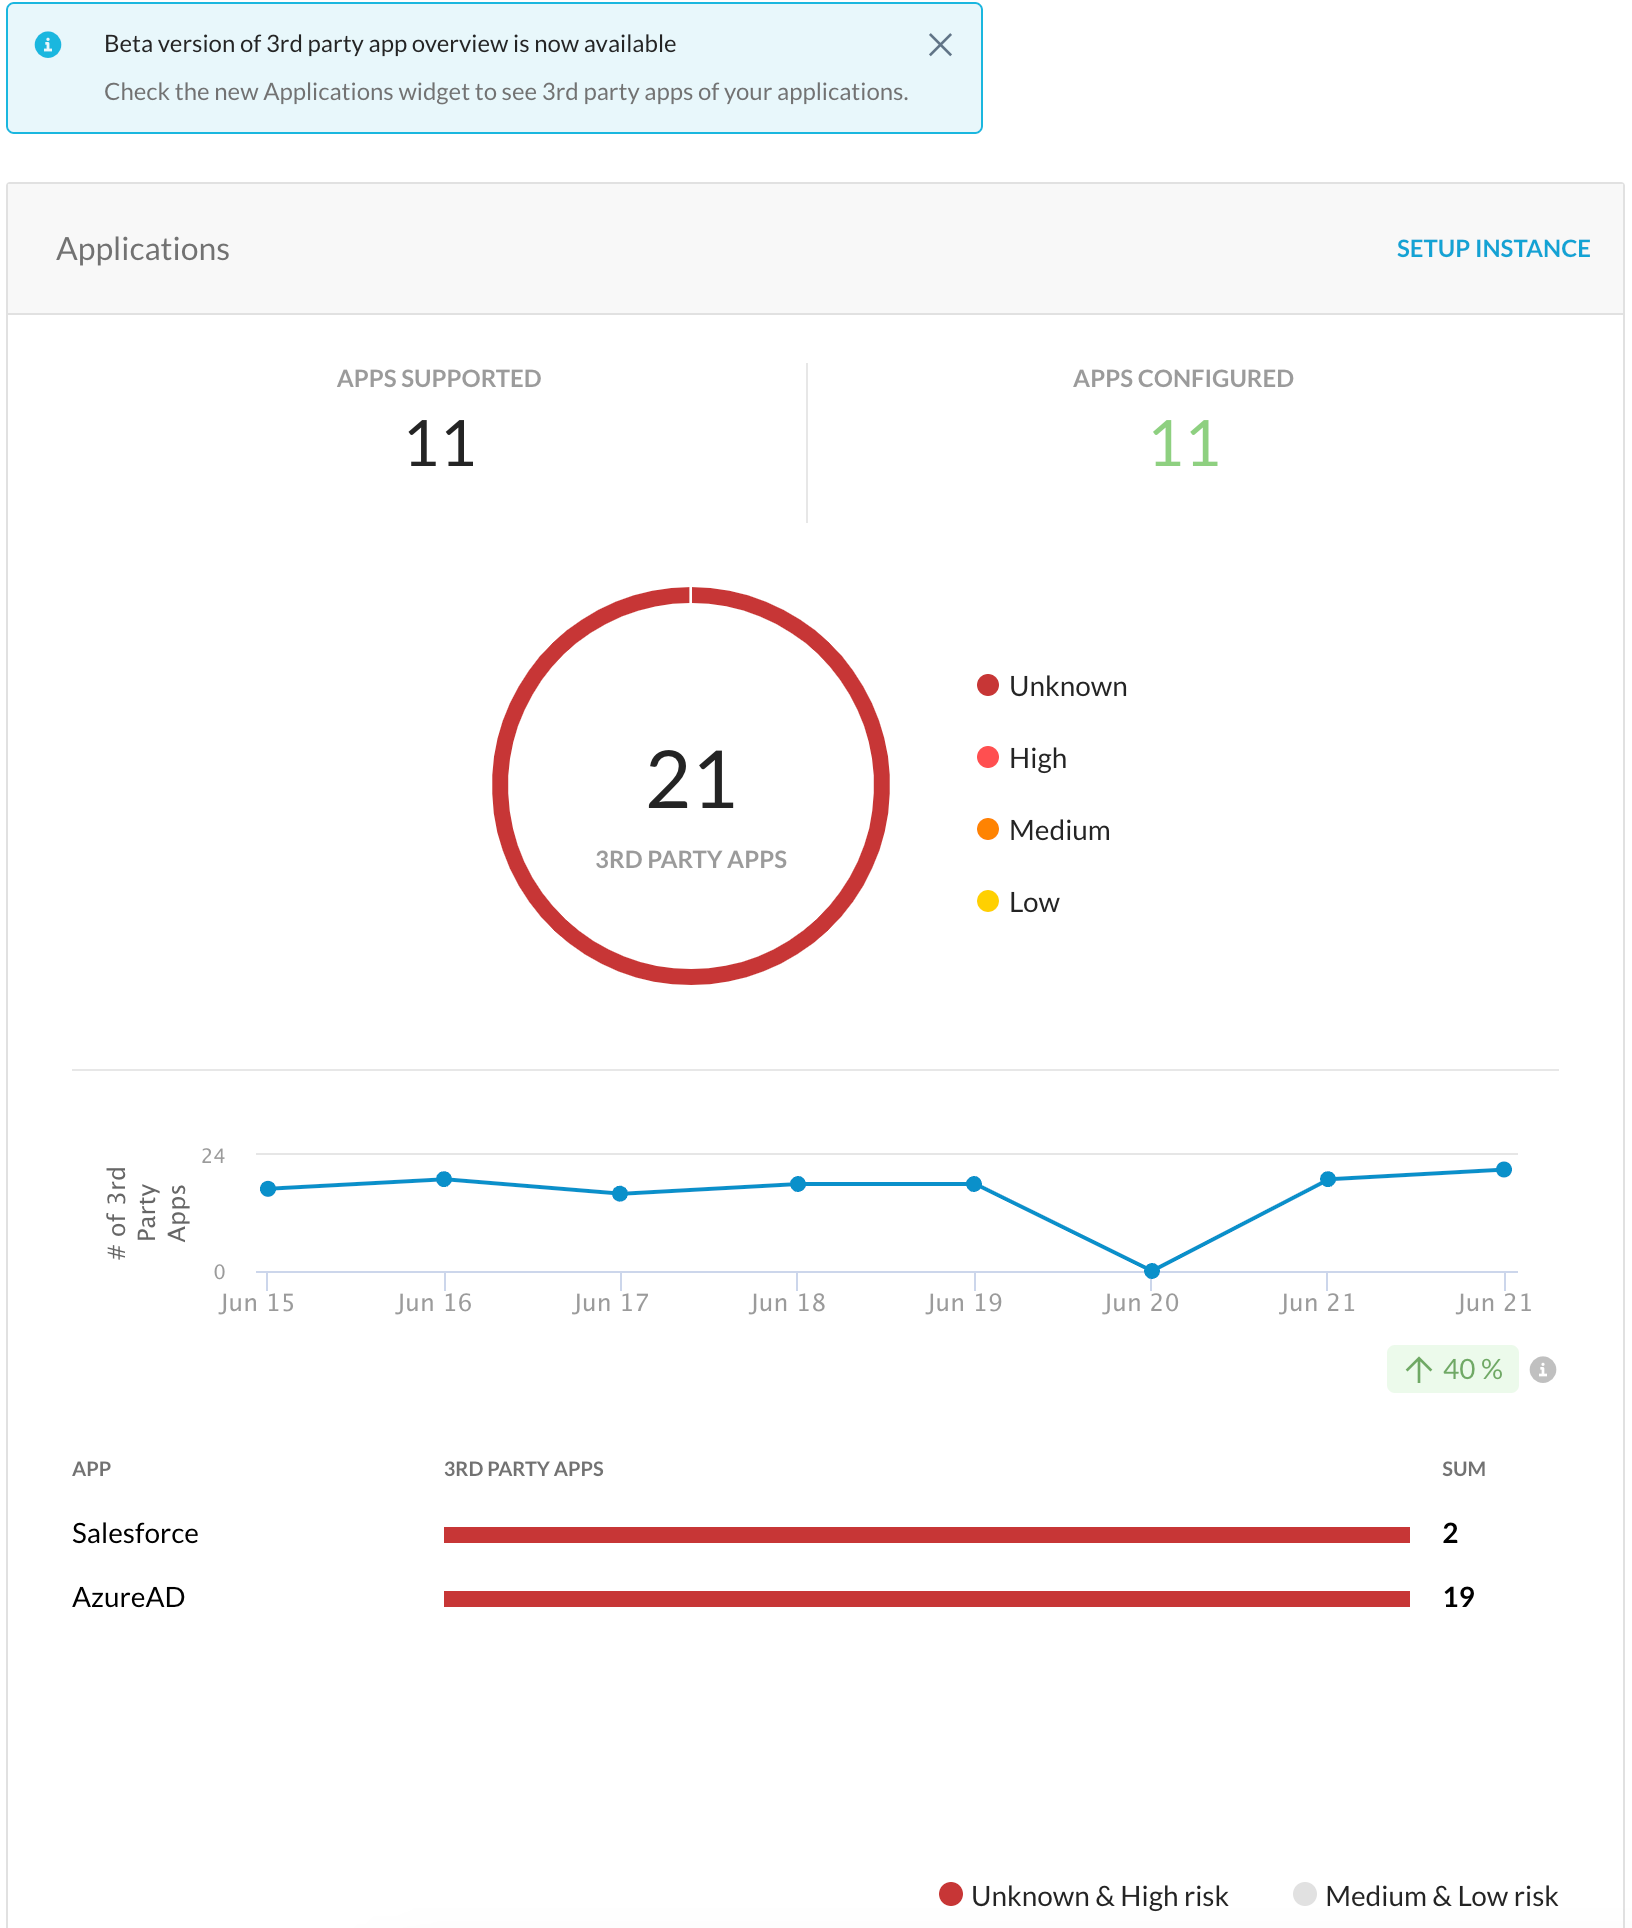
Applications: This widget displays a summary of all the SaaS apps configured in Next Generation SSPM. It also shows the apps that are not configured. For the non-configured apps, you can click the SETUP INSTANCE link at the top-right corner of the Application widget. This takes you to the instance set up page where you can set up the non-configured SaaS apps.
The widget also shows a summary of 3rd-party connected apps. Connected app is a mechanism to link a 3rd-party application to a SaaS application platform using OAuth for authorization. For example, Box for Salesforce is a connected app that allows integration between Salesforce and Box. The 3rd-party connected apps are categorized by a risk level. Though the widget displays 4 risk levels, all 3rd-party connected apps are categorized under the Unknown risk level. In a future release, they will be categorized under appropriate risk levels. Clicking the donut chart takes you to the Inventory > Resources page to list the 3rd-party connected apps with appropriate risk level filter. However, editing the current filter (Risk Level: Unknown) on the Inventory > Resources page resets the result. This issue will be resolved in a future release.
Note
3rd-party connected apps is a beta feature. Currently, Netskope supports AzureAD and Salesforce 3rd-party connected apps.
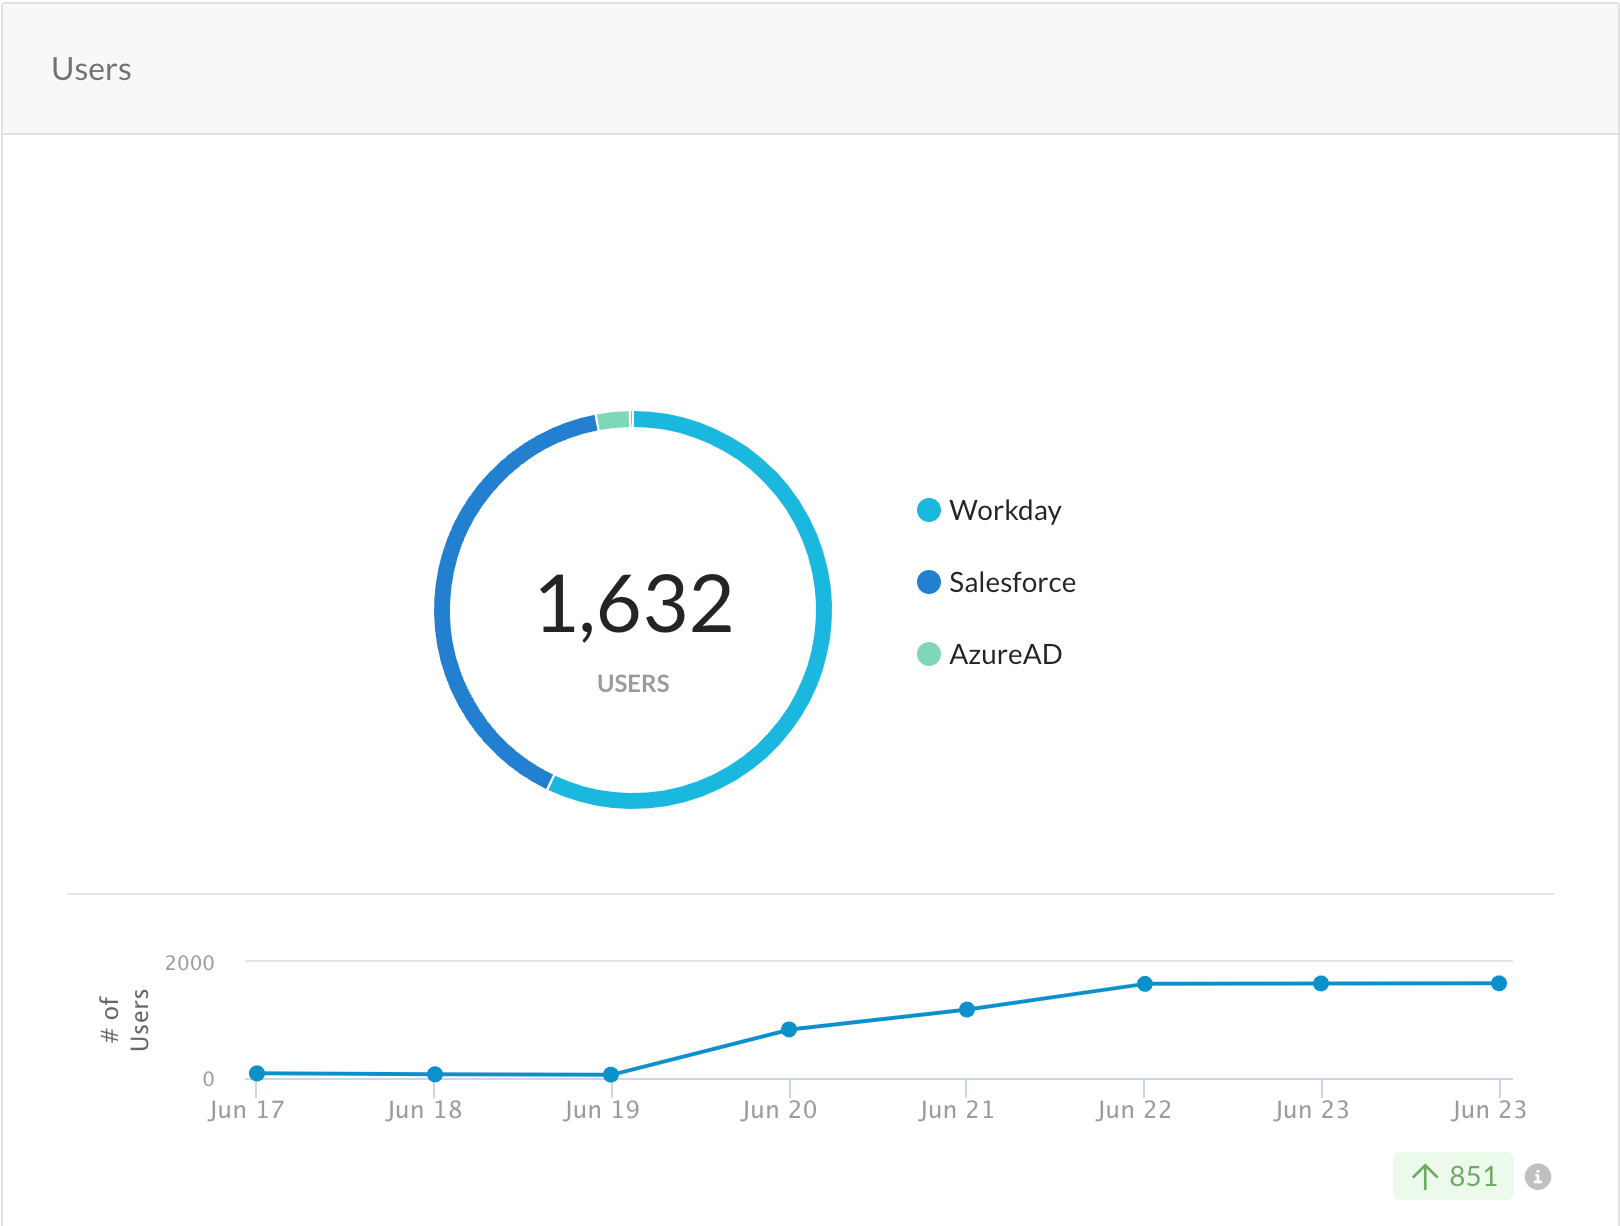
Users: This widget displays the total number of users across all configured SaaS apps. The donut chart also gives a breakdown of users by configured SaaS apps. You can click a part of the donut chart or the total users' count. Once you click, the page redirects to the Inventory > Resources page with preselected filters. You can view the list of users.
Note
When you click the Workday user count of the donut chart, the page redirects to the Inventory > Resources page. However, there is no data in the Resource table. To fix this issue, change the Resource Type filter value from User to Workday Account.
The widget also displays a trend chart. It shows the user trend count in the last 7 days. At the bottom-right, there is a percentage (%) value. This shows the % change between the current date and the past weeks' average.
Note
The Users widget displays users for Microsoft 365, Azure AD, Salesforce, and Workday apps only.
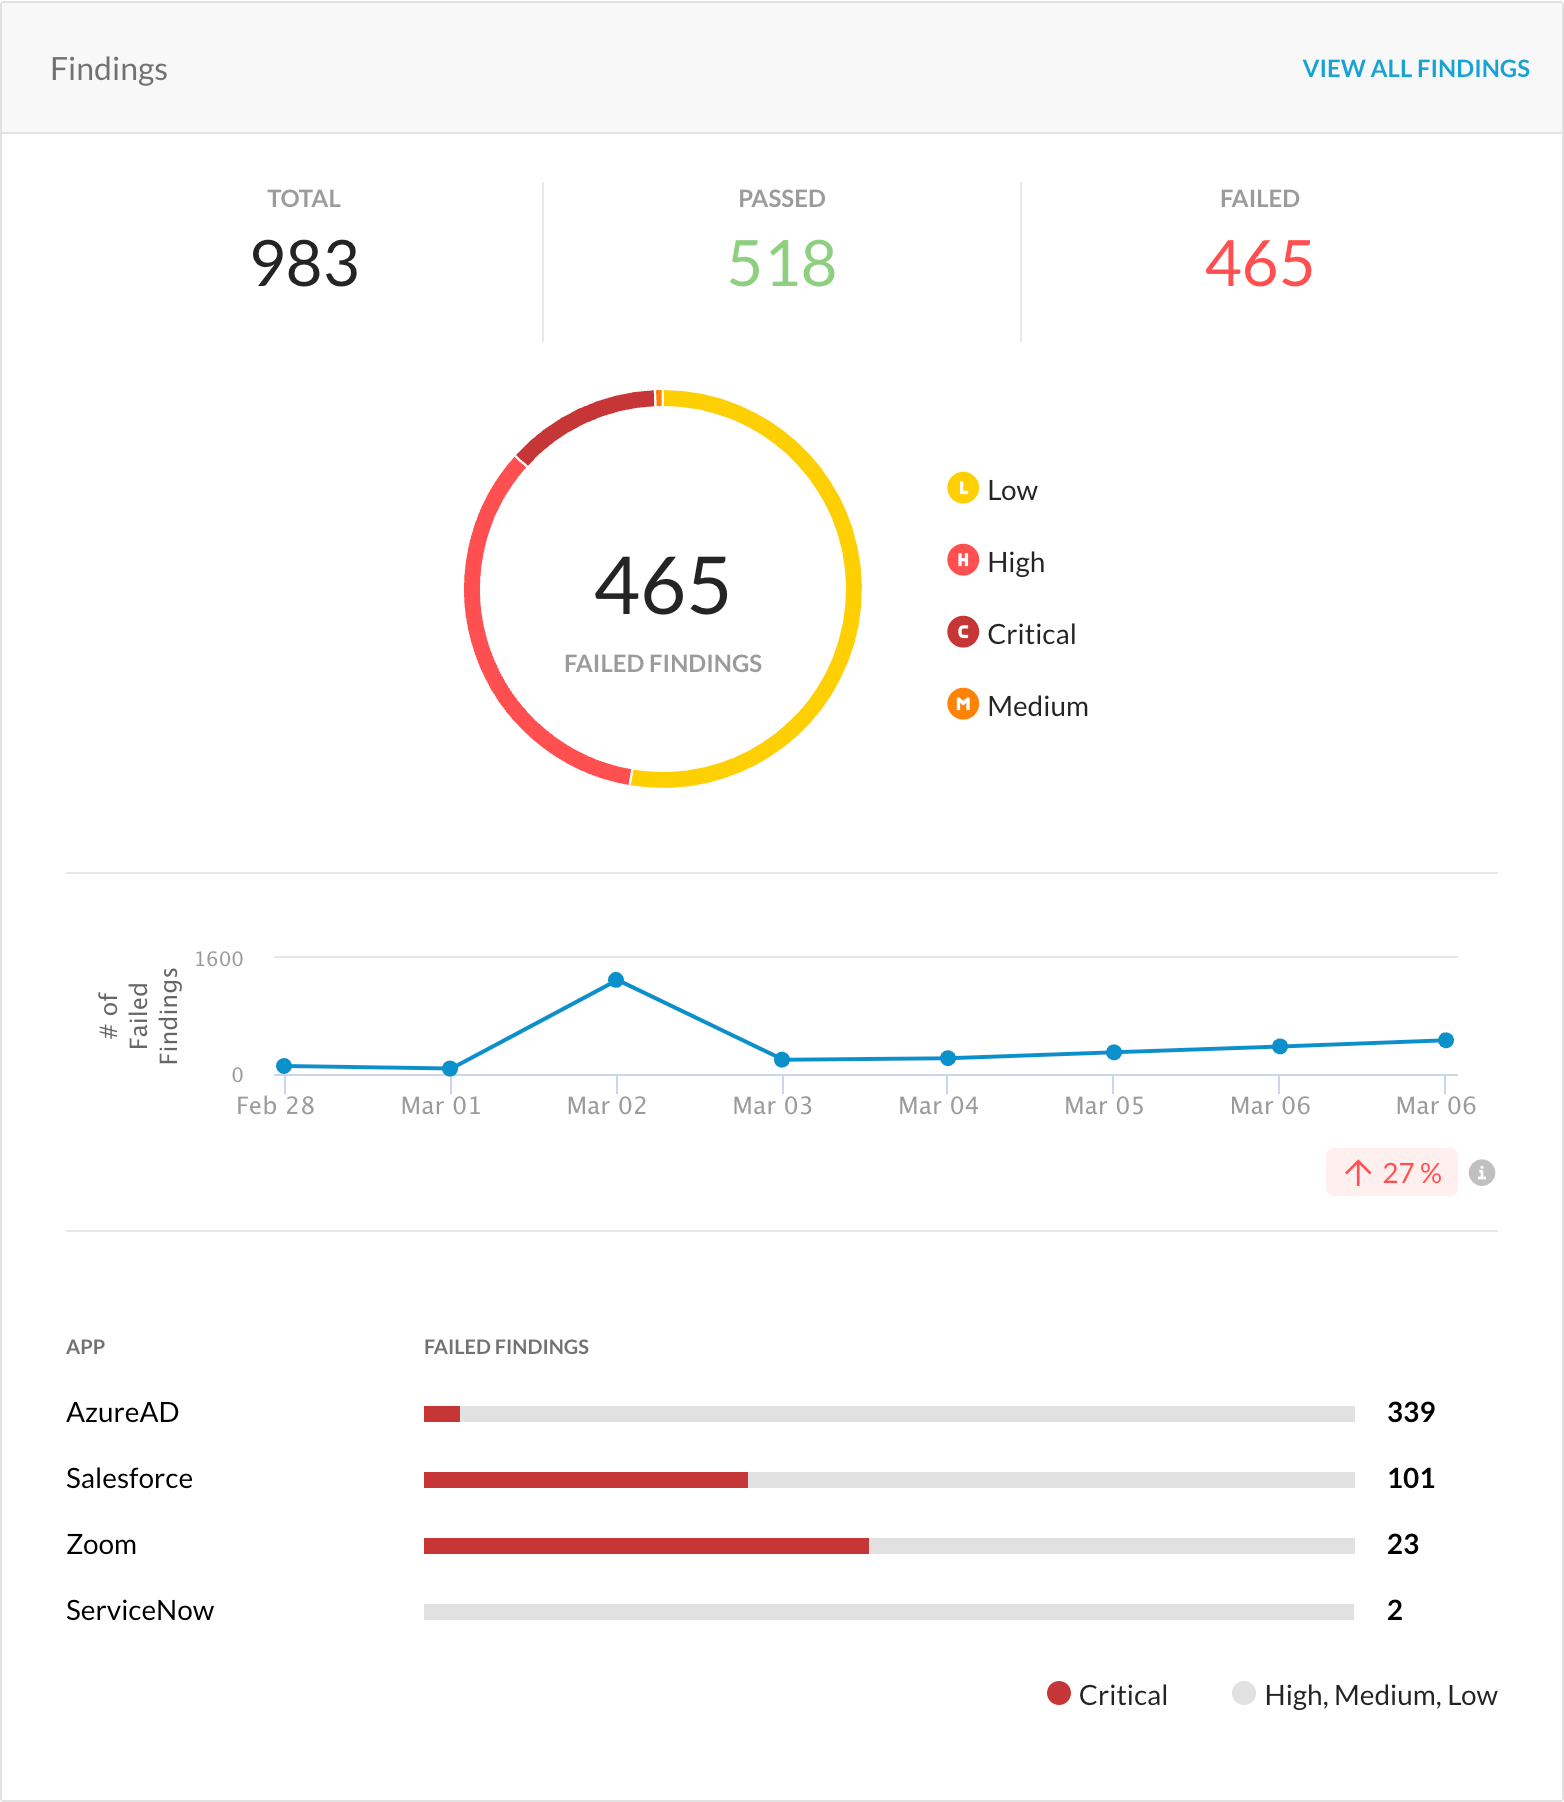
Findings: This widget displays the total number of raw findings which includes passed and failed rules and findings. On the top-right corner of the widget, you can click VIEW FAILED FINDINGS. This takes you to the Findings > Raw Findings page. You can view all the failed findings.
You can also click the total, passed, and failed numbers. This takes you to the Findings > Raw Findings page with preselected filters.
The donut chart displays the total number of failed findings by severity. You can click a part of the donut chart or the total failed findings. Once you click, the page redirects to the Findings > Raw Findings page with preselected filters.
The widget also displays a trend chart. It shows the failed findings trend count in the last 7 days. At the bottom-right of the trend graph, there is a % value. This shows the % change between the current date and the past weeks' average.
At the bottom of the widget, you can see a bar graph that displays the failed findings count categorized by the configured SaaS apps. The failed findings are further classified by severity. You can click a part of the bar graph. Once you click, the page redirects to the Findingse > Raw Findings page with preselected filters.
Compliance: This widget displays the compliance standard pass %, % of passed rules by compliance standard, past 7 days trend graph, and failed findings count by compliance standard. On the tip-right of the widget, you can click VIEW ALL RULES. This takes you to the Findings > Rules page. You can view all the rules.
You can also click the total, pass rate %, passed, and failed numbers. This takes you to the Findings > Rules page with preselected filters.
The widget also displays a bar graph consisting of % of passed rules by compliance standard. The % of passed rules are further classified by failed and passed rules.
Important
It is important to note that a single rule can be part of multiple compliance standards. Keeping this in mind, though a user has configured a single compliance standard in the policy wizard, the rule(s) may be part of multiple compliance standards. Therefore, the bar graph may display additional compliance standards although the user has configured a single compliance standard.
The widget also displays a trend chart. It shows the pass % rate trend count in the last 7 days. At the bottom-right of the trend graph, there is a % value. This shows the % change between the current date and the past weeks' average.
At the bottom of the widget, you can see a bar graph that displays the failed findings count by compliance standard. The failed findings are further classified by severity. You can click a part of the bar graph. Once you click, the page redirects to the Findings > Raw Findings page with preselected filters.
