About DLP
Netskope Data Loss Prevention (DLP) protects sensitive data in the cloud with accuracy and precision by inspecting all sanctioned and unsanctioned cloud services. When users violate a DLP policy, Netskope logs the incident. If you have Endpoint DLP, users that violate your Content Control policies also trigger a DLP incident.
Note
Incidents are generated for each file/sub-file that matches DLP Profile(s) and the corresponding DLP Rules, Fingerprint Rules, ML-based Classifiers or File Profiles. A sub-file is any file within a container file (e.g. file within a zip/tar or an image in a pptx document or a spreadsheet in a docx file). One incident will be generated for each container file and one each for any sub-files that match DLP Profiles.
If a PowerPoint document matches a DLP Rule used in a DLP Profile, one incident will be created for that file. If an embedded image of a Credit Card in the same PowerPoint document matches an ML-based Classifier for Credit Cards, another incident will be created for that image.
Viewing DLP Incidents
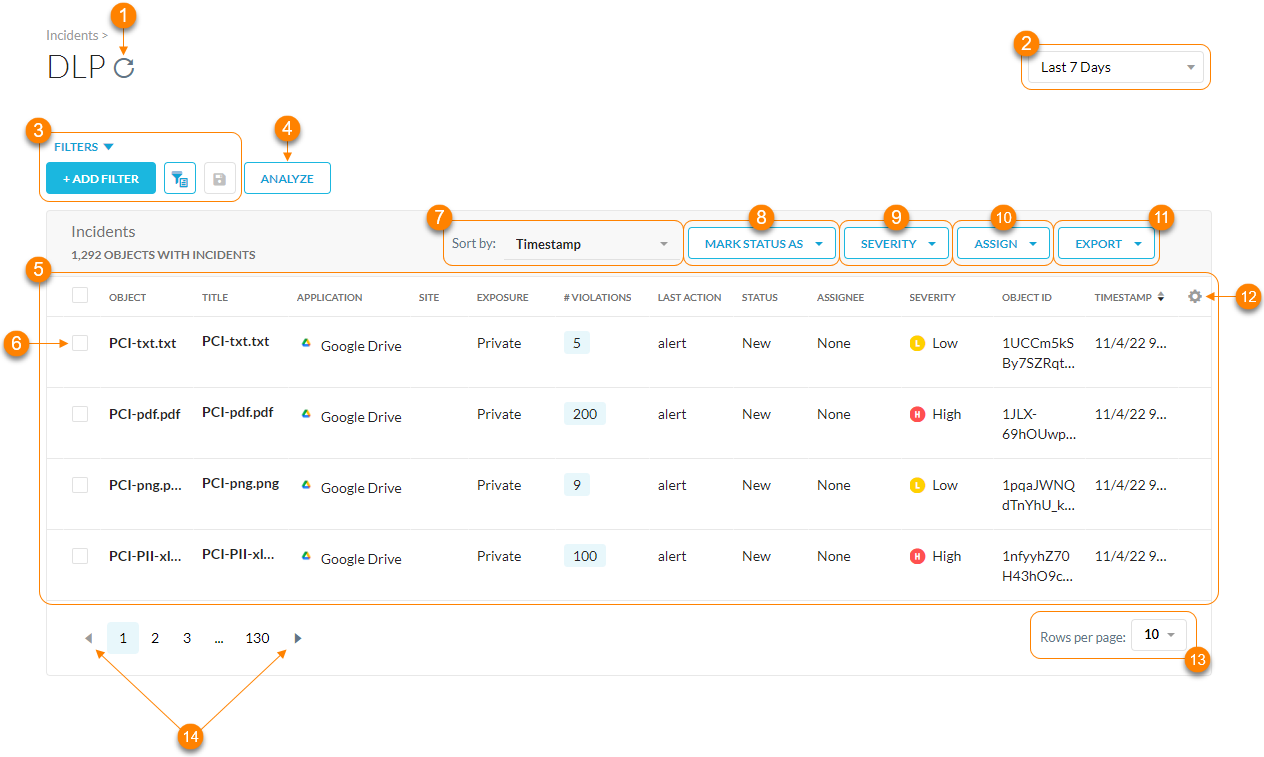
To view DLP incidents in your organization, go to Incidents > DLP.
Refresh the DLP incident results.
Filter DLP incidents by a specific time frame. You can use a predefined time frame or choose Date Range to use the calendar and time menus to customize your own.
Search and filter the DLP incidents by a query. Click + Add Filter to add other filters to narrow your search results. For example, you can choose Block for the Last Action and select an application to only view DLP incidents that match this criteria. You can also click
 to switch to the advanced query search mode. Click
  to save the filter combination for future searches.
Note
If you have Endpoint DLP, you can filter incidents by Endpoint Content Control Policy.
View the top 5 applications, exposures, and top 5 policies with violations.
View a list of DLP incidents. For each incident, you can see the following default information:
Object: The file or object name that triggered the violation. Click to open a page with more details where you can change status, assign incidents, change severity, and take actions.
Application: The application that triggered the violation.
Site: The website that triggered the violation.
Exposure: The exposure level of the file.
Public - Indexed
Public - Unlisted
Public
Private
Externally Shared
Internally Shared
Enterprise Shared
Cross-Geo
# Violations: The total number of violations with file. The count refers to the aggregated number of records detected across all the policies in the incident.
Last Action: The action that was taken, such as allow, block, alert, etc.
Status: Shows the state of the event. There are three states:
New
In Progress
Resolved
Assignee: The person assigned to monitor the incident.
Severity: The severity level of the object or file. There are four levels:
Low
Medium
High
Critical
In addition, if you selected Count only unique record under Severity Threshold for a DLP rule, then the severity displays the count as Count: <Number of Violations> unique. If you deselect Count only unique record, the severity count is displayed as Count: <Number of Violations>.
Object ID: The ID of the object or file.
Timestamp: The date and time that the violation occurred.
Instance: The application instance that triggered the violation.
Instance Id: The ID of the application instance.
Last Modified By: The user that made the latest changes to the file when Netskope processed it.
Object Owner: The original owner of the object or file.
File Path: The full file path on the device.
DLP Policy: The DLP policy that triggered the violation.
DLP Profile: The DLP profile associated with the DLP policy and violation.
DLP Rule: The DLP rules associated with the DLP policy and violation.
Select one or more objects to update the Mark Status As and Severity as well as Assign someone to monitor the incident.
Sort the table by the following:
Object
Application
Site
Exposure
Status
Assignee
Severity
Instance
Last Modified By
Object Owner
Timestamp
Select one or more objects to update the status. You also can:
Create Custom Status: Create a name for a custom status.
Manage Custom Statuses: View, edit, or delete any custom states.
Select one or more objects to edit the severity level.
Select one or more objects to choose an email address of an admin to monitor the incident.
Export all DLP incidents (up to 500,000 rows) to a CSV file as a summary or including all details.
Click
 to customize table columns or restore the default ones.
View up to 100 DLP incidents per page.
View multiple pages of the table.

Viewing Object Details
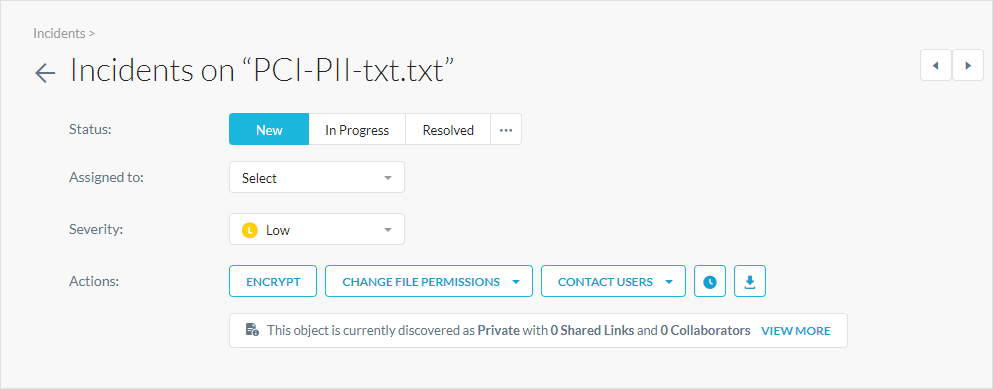
On the DLP page, you can click the Object to see more comprehensive details.

At the top of the Object Details page, you can edit the:
Status: Choose a status for the object. Click
 to:
to:Create Custom Status: Create a name for a custom status.
Manage Custom Statuses: View, edit, or delete any custom states.
Assigned to: Choose an email address of an admin to monitor the object.
Severity: Choose a severity level for the object.
Actions: Perform any of the following actions.
Encrypt: Encrypt the object.
Restore: Restore the object.
Block: Block the object.
Note
The Netskope tenant UI has disabled the encrypt, restore, block actions for files with 'require check out' option enabled in Microsoft Office 365 SharePoint Sites. In cases when 'require check out' is enabled, a copy of the file will be placed in quarantine, however, the original file will not be deleted.

Delete: Delete the object.
Change File Permissions: Change the object permissions by restricting access to certain admins, users, file owners, etc.
Contact Users: Contact the users involved with the object.
Check Object History: View the history around the object, including all incidents that occurred with the object, logs of remediation or actions taken on the object, and other activity and version information related to the object from API Data Protection.
Download Object: Download the incident object to the folder defined in your Forensic Profile. To learn more: Downloading DLP Incident Files.
View More: View current summary details on the object, including basic info, shared links, collaborators, and version history.
When a tombstone fails, Netskope displays an error message:


Viewing the Incident Detail
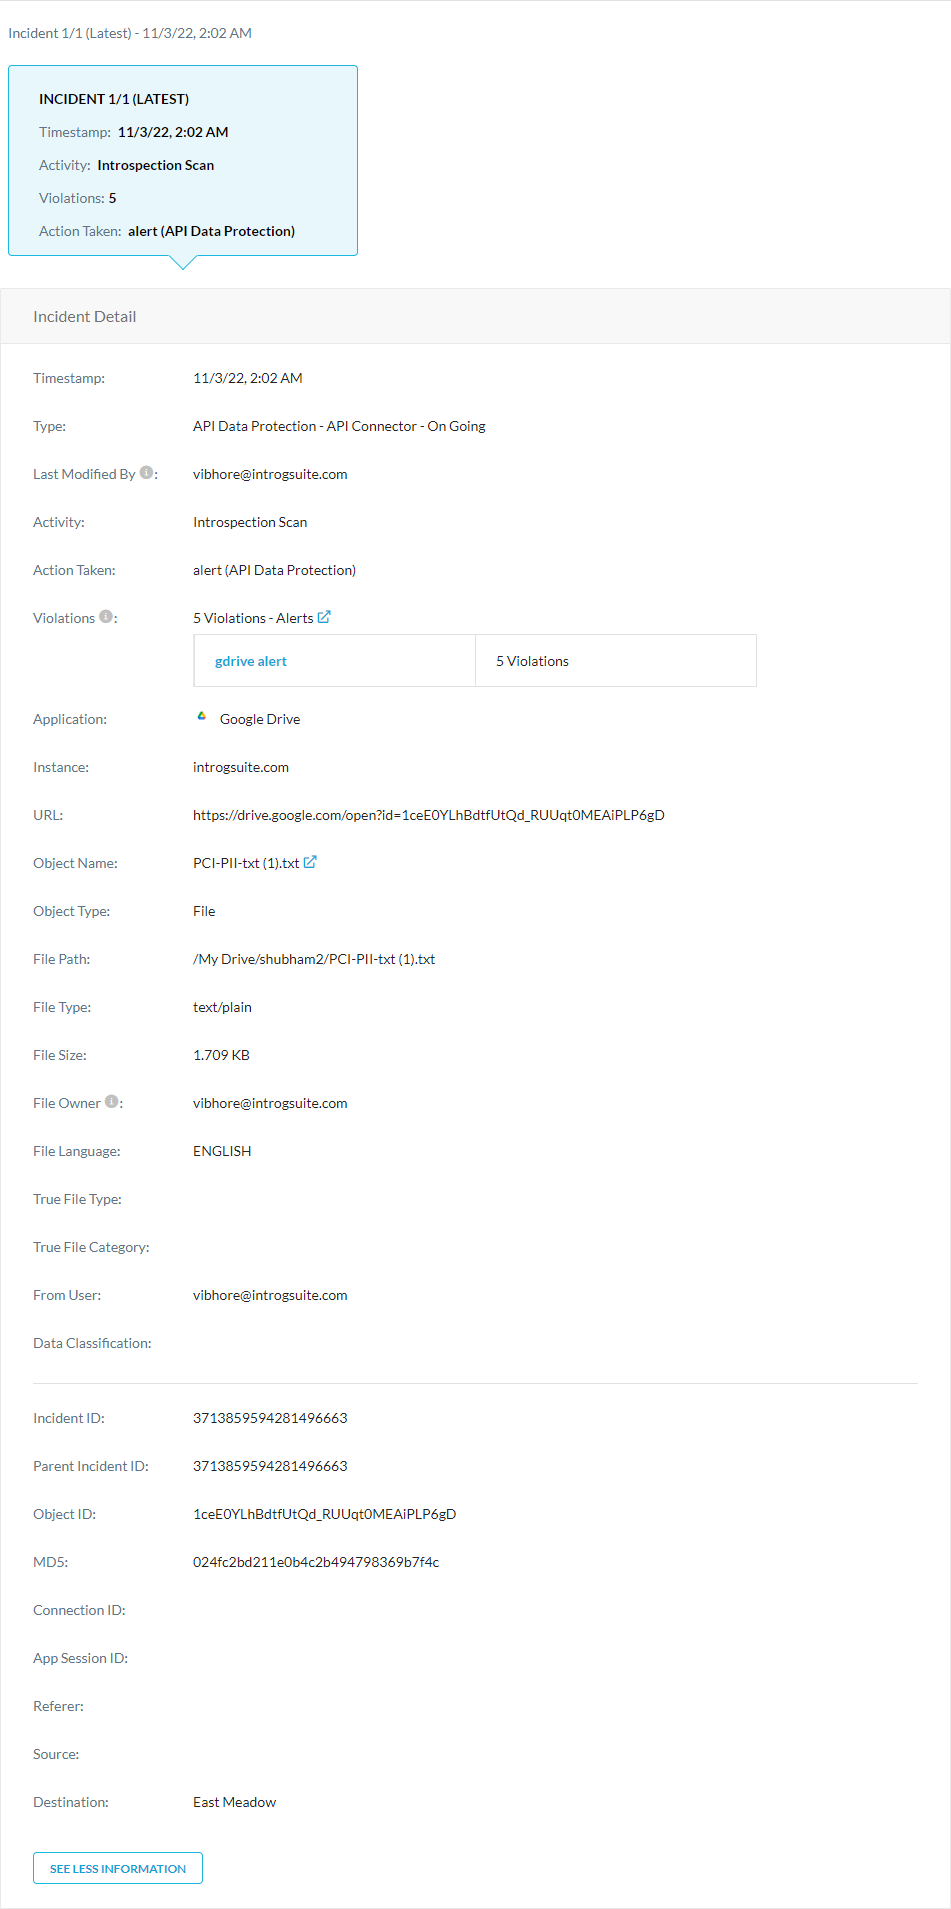
Under Incident Detail on the Object Details page, you can see comprehensive object details:
Timestamp: The date and time that the violation occurred.
Type: The type of incident.
Last Modified By: The user that made the latest changes to the file when Netskope processed it.
Activity: The activity associated with the incident.
Action Taken: The action taken on the incident based on your policies.
Violations: The total number of violations with file. The count refers to the aggregated number of records detected across all the policies in the incident. Click
 to go to the Skope IT Alerts.
Application: The cloud application (e.g., Dropbox) that triggered the violation.
Site: The site that triggered the violation. If the Traffic Type is Cloud App, the site displays the cloud app name. If the Traffic Type is Web, the site displays the second level domain name and top-level domain name. For example, for "www.cnn.com", it’s "cnn.com".
Instance: The application instance that triggered the violation.
URL: The URL of the file or application that triggered the violation.
Object Name: The file or object name that triggered the violation. Click
 to go to File Details in API-enabled Protection.
Object Type: The type of the object that is being acted on. It might be a file, folder, report, document, message, etc.
File Path: The full file path on the user's device.
File Type: The type of file.
File Size: The file size in bytes.
File Owner: The creator of the file in the application.
Note
In Google Drive, when you change ownership of a folder, it changes the ownership of the selected folder only and does not include the files inside. For example, if you change the ownership of a folder from user A to user B:
the ownership of the folder changes to user B.
the ownership of the contents of the folder i.e., files and folders does not change to user B. It remains with user A.
File Language: The written language of the file.
True File Type: The type of true file.
True File Category: The category of the true file.
From User: The email address used to login to the SaaS app.
Channel: The channel of the user for Slack and Slack Enterprise apps.
Data Classification: The data classification details.
Incident ID: The incident ID associated with the subfile. If the incident is triggered for the main file, the incident ID will be the same as the parent incident ID.
Parent Incident ID: The incident ID associated with the main container (or non-container) file that was scanned.
Object ID: The ID of the object or file.
MD5: The MD5 hash of the file. You can use this hash value to filter Skope IT events and view other activity associated with the file.
Connection ID: The ID for the connection incident. Each connection has a unique ID.
App Session ID: The unique app/site session ID when the Traffic Type is Cloud App or Web. An app session starts when users start using a cloud app/site and end after they’ve been inactive for a certain period of time (e.g., 15 mins). You can use this ID to check all the user activities in a single app session. The app session ID is unique for a user, device, browser, and domain.
Referer: The referrer URL of the application (with HTTP) that the user visited.
Source: The user's city as determined by the Maxmind or IP2Location Geodatabase.
Destination: The application's city as determined by the Maxmind or IP2Location Geodatabase.

Viewing Violations
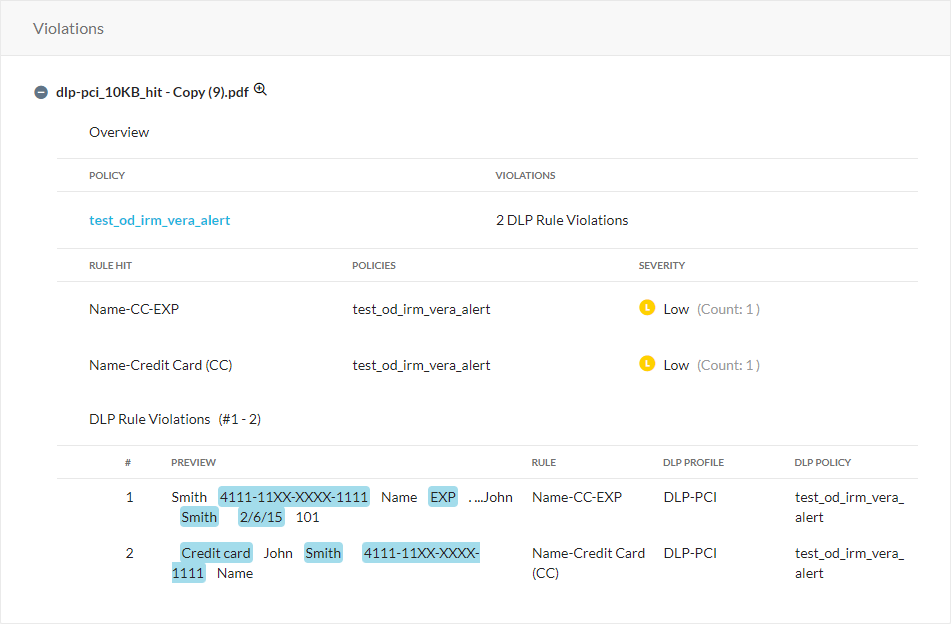
Under Violations on the Object Details page, you can see a list of all the DLP violations for the object:
Click
 to view a preview of the data identifier matches. You can hover over the highlighted matches to see the DLP profile triggered, data identifier, DLP rule triggered, and severity level. Not all matches are highlighted due to storage limit.
Under Overview, see the following:
Policy: The triggered DLP policy. Click Edit Policy to go to the Real-time Protection page and edit the DLP policy.
Violations: The total number of violations for the DLP policy.
Rule Hit: A list of triggered DLP rules.
Policies: A list of DLP policies associated with the triggered DLP rule.
Severity: The severity level and hit count for each DLP rule. If you selected Count only unique record under Severity Threshold for a DLP rule, then the severity displays the count as Count: <Number of Violations> unique. If you deselect Count only unique record, the severity count is displayed as Count: <Number of Violations>.
Under DLP Rule Violations, see the following:
#: The violation number.
Preview: A list of the data identifier matches. Hover over to see the triggered data identifier.
Rule: Click to view details on the associated DLP rule. Click View Rule to go to the DLP Rule page.
DLP Profile: Click to view details on the associated DLP profile. Click View Profile to go to the DLP Profile page.
DLP Policy: Click to view details on why the violation triggered the DLP policy. Click Edit Policy to go to the Real-time Protection page and edit the DLP policy.

Viewing DLP Incidents Related to Deleted Files
To see if a file was deleted:
Go to Incidents > DLP.
Click the Object. The Object Details page appears.

Under Actions, Netskope displays an attention message:
