Using Advanced Analytics
To use Advanced Analytics for remediation of IaaS misconfigurations, follow the steps shown below:
Navigate to Advanced Analytics > Netskope Library.
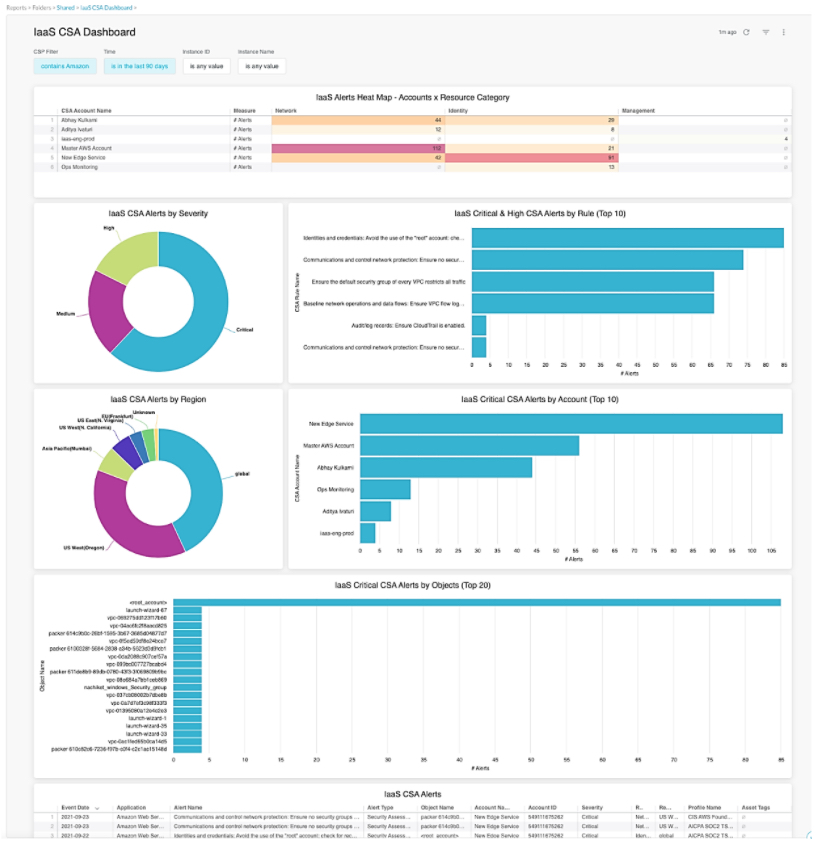
Select one or many from IaaS CSA Dashboard, IaaS dashboard, IaaS Storage Scan Dashboard, Unsanctioned IaaS Dashboard and Multi Cloud CSA Dashboard.
Run the dashboard(s) for the required time period.
Check the results of the dashboard(s) to identify key areas of remediation and perform remediation steps as described in Auto Remediation or Manual steps for remediation.

Type of information obtained from the dashboards is shown below:
IaaS CSA Dashboard | IaaS CSA Dashboard | IaaS Storage Scan Dashboard | Multi Cloud CSA Dashboard | Unsanctioned IaaS Dashboard |
|---|---|---|---|---|
Get overall details of CSA alerts by severity, region, account:
| This dashboard offers a view into IaaS account health by addressing the following topics and questions:
| Gives a high-level overview of Data Protection, Threat Protection and Security Assessment in IaaS apps/platforms. Including:
| Get overall IaaS metrics across all accounts:
| Identity unsanctioned IaaS instances by instance id and users associated. Get details of hits by users and alerts. All the data here is obtained from inline traffic. |