Syslog and WebTx Plugins with Splunk for Log Shipper
This document explains how to ingest Netskope Alerts, Events, and web transaction logs in CEF format from Netskope Tenant to Splunk using Cloud Exchange via the Log Shipper Syslog and WebTx plugins.
Refer to System requirements for different configurations. It is recommended to use the system with the medium specification if your data volume ranges to 100k EPM.
To complete this configuration, you need:
A Netskope Tenant (or multiple, for example, production and development/test instances)
A Netskope Cloud Exchange tenant with the Log Shipper module already configured.
A Splunk instance.
Create a Data Collector on Splunk.
Configure the Syslog Plugin for the Splunk integration.
Configure the WebTx Plugin for the Splunk integration.
Configure a Log Shipper Business Rule for the Splunk integration.
Configure Log Shipper SIEM Mappings for the Splunk integration.
Validate the Splunk integration.
Click play to watch a video.
If you do not have a Splunk instance, follow these steps to install Splunk.
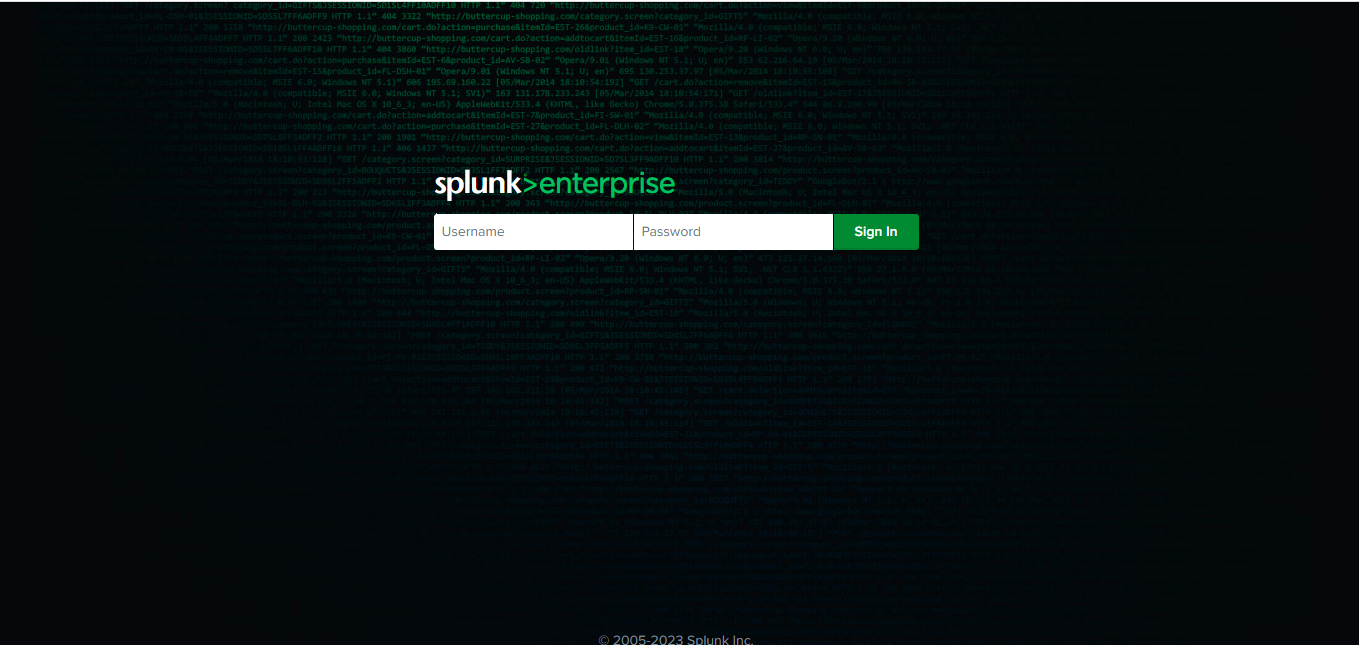
Log in to your Splunk instance.
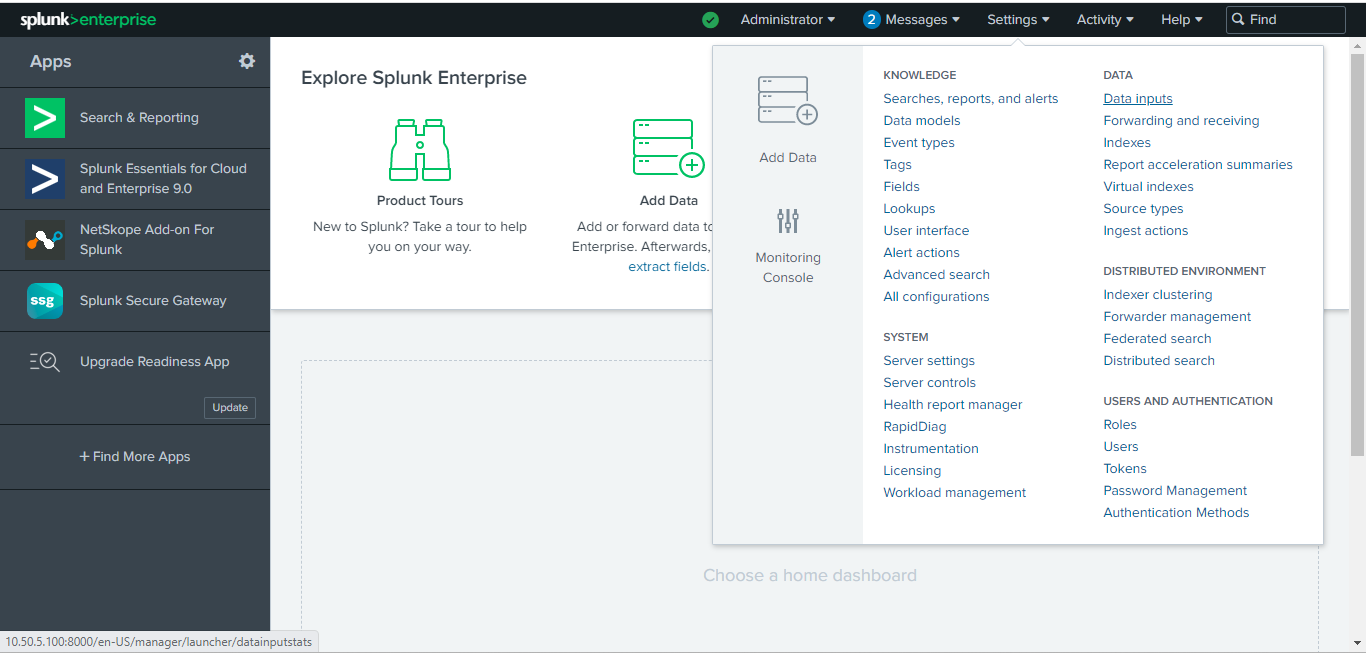
From the dashboard, go to Settings > Data inputs.
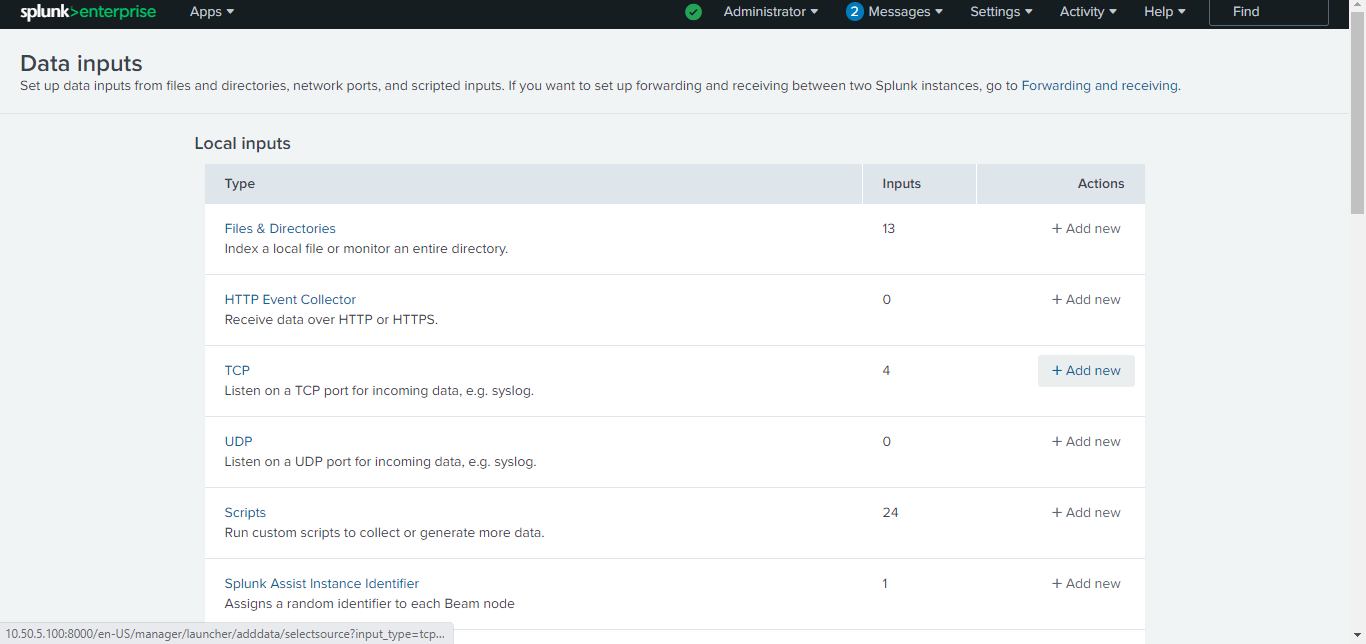
Click Add new for the TCP input.
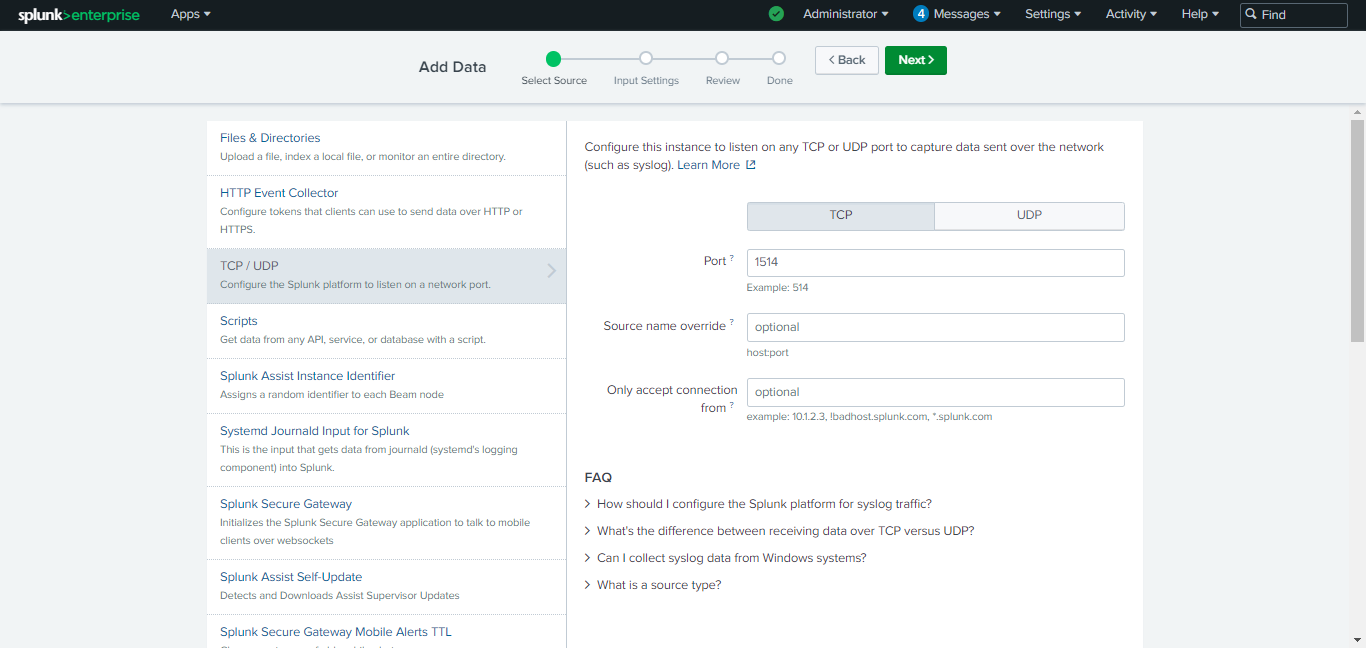
Add your port and click Next.
Select the source type if you already have any, or click New to create a new source type.
Enter the source type. Select the Source Type Category based on your requirements, or keep it as is.
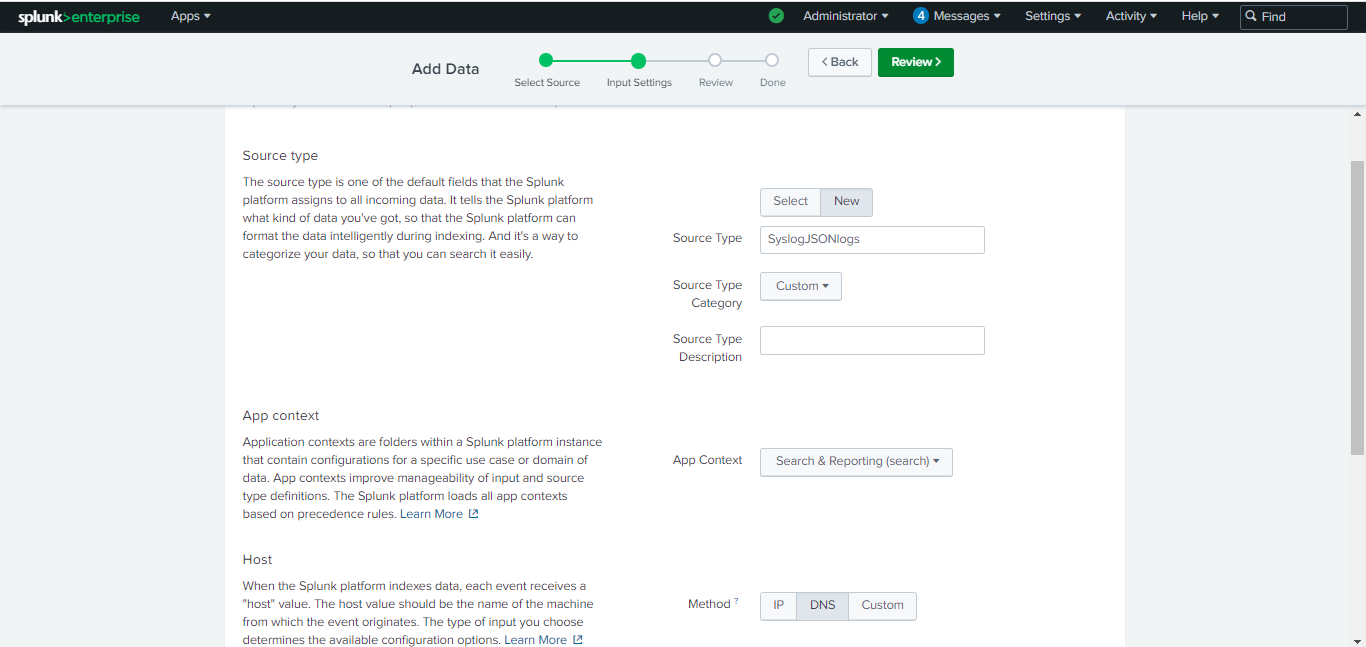
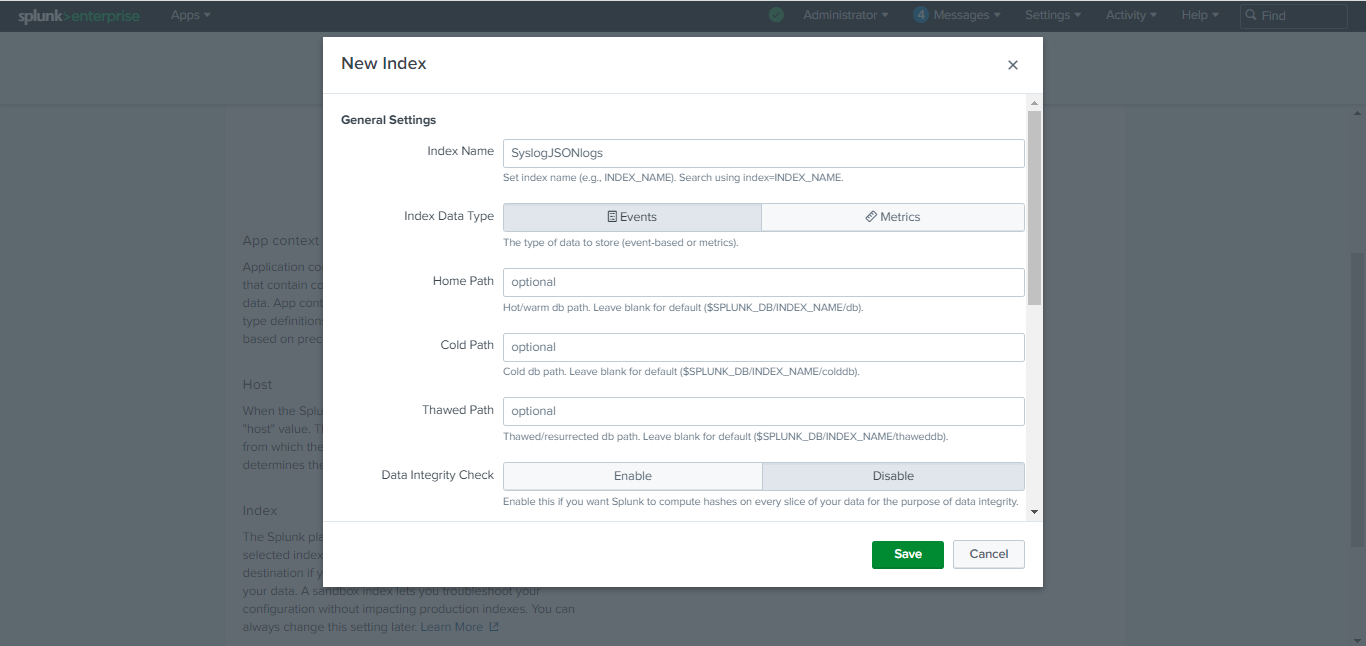
Scroll down to Index. If you already have any index that you want to use, select it from the Index dropdown. Otherwise, click Create a new index, add an Index Name, click Save, and then click Review.
Review the details and click Submit.
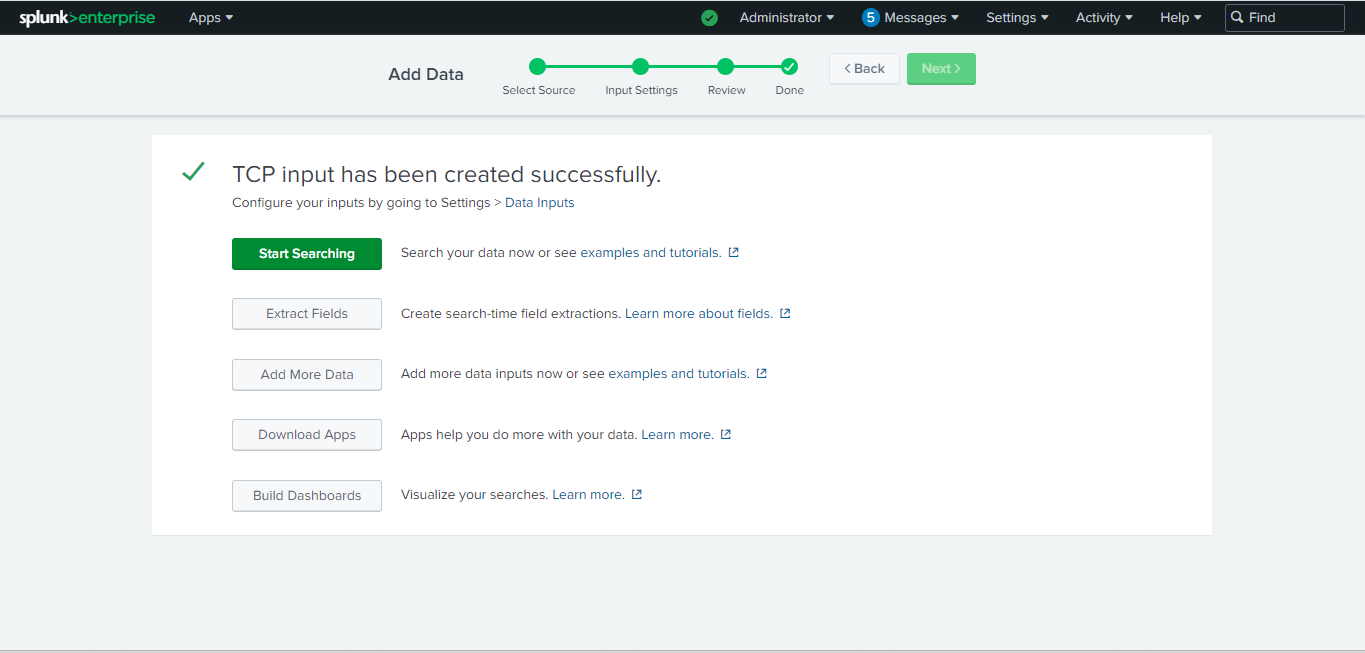
Click Start searching.
Go to Settings > Plugins. Search for and select the Syslog CLS plugin box.
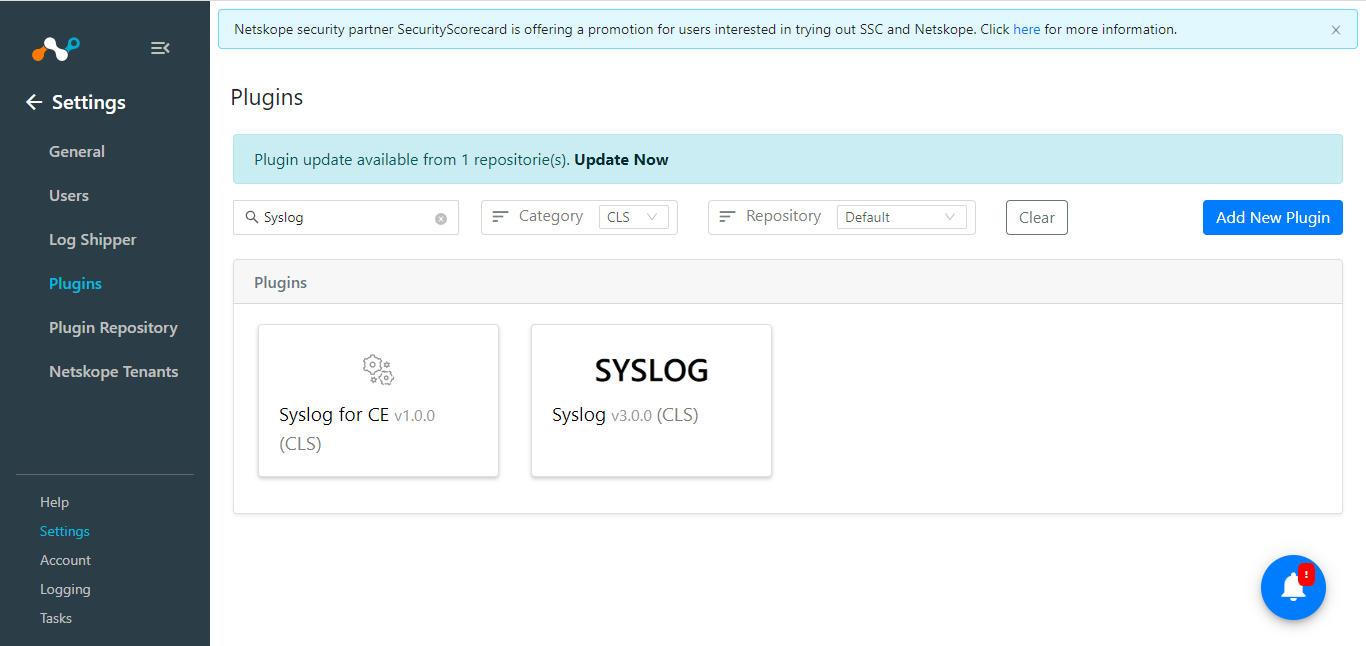
Add a Plugin configuration name and click Next.
Disable the first toggle button if you want to ingest your alerts and events in the JSON format. Keep it as it enabled if you want to ingest your data into CEF format.
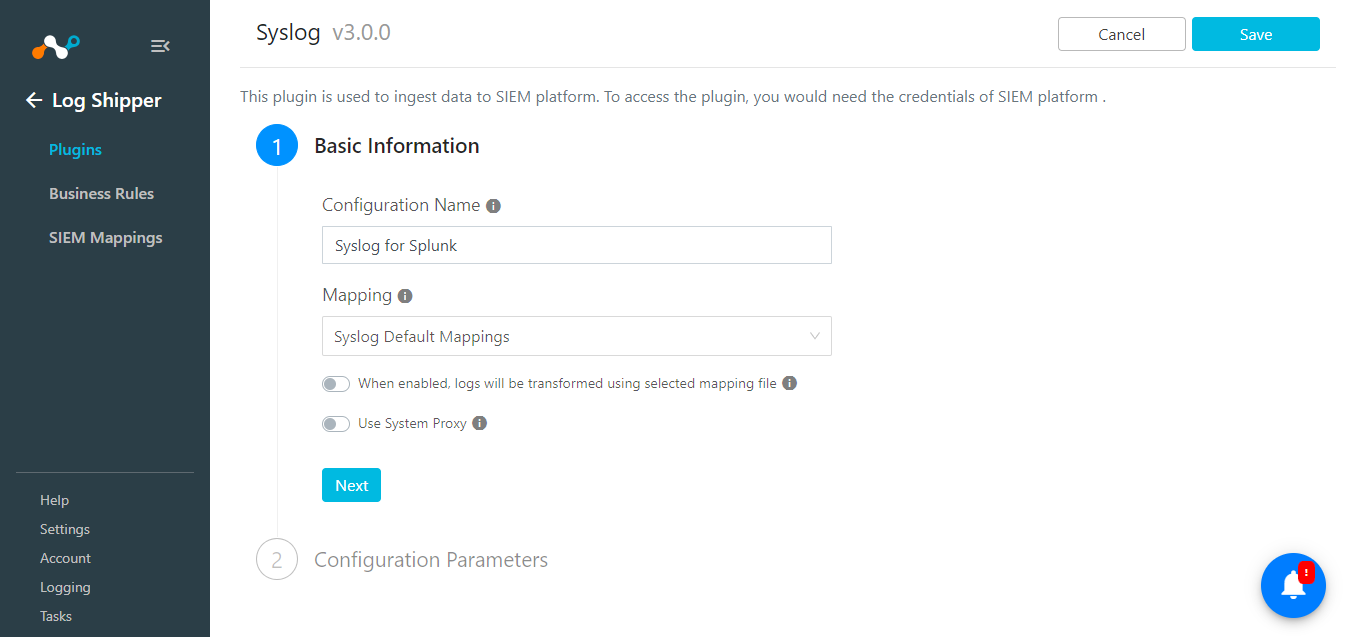
Click Next.
Enter these parameters:
Syslog server: The IP address of the Splunk instance.
Syslog Protocol: The protocol used to create the Data input on Splunk TCP.
Syslog Port: The port used to create the Data input configuration on Splunk.
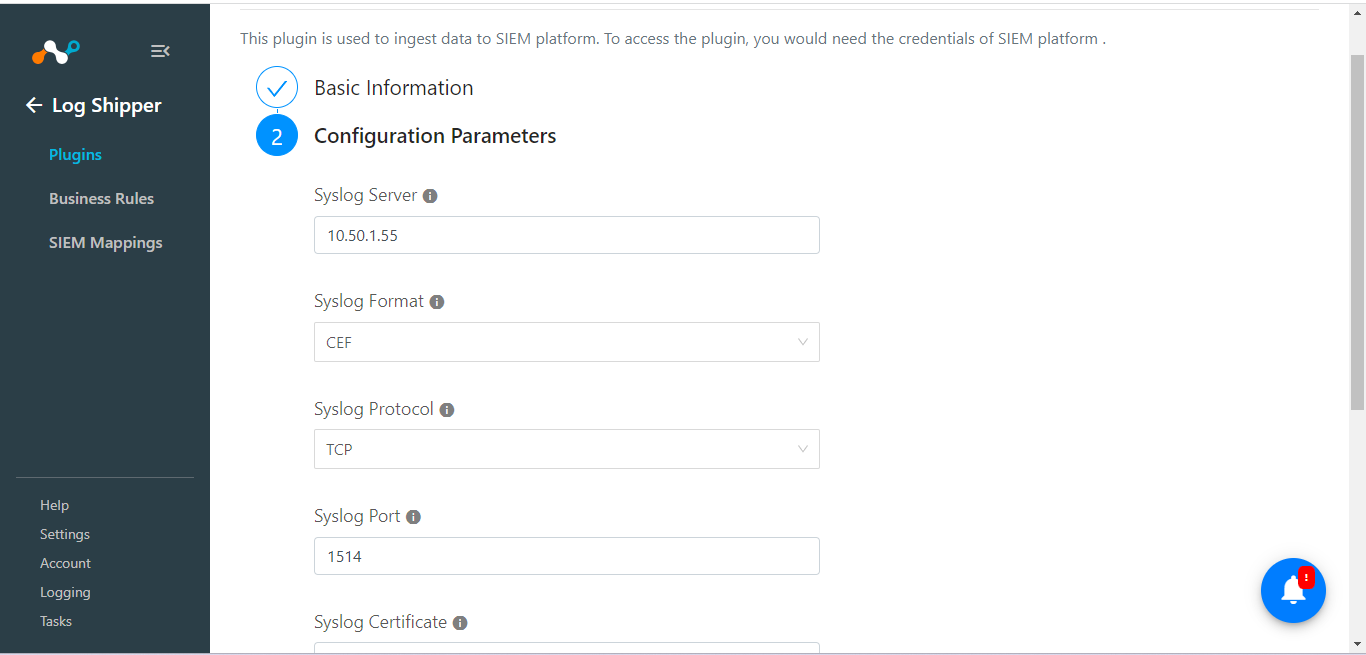
Click Save.
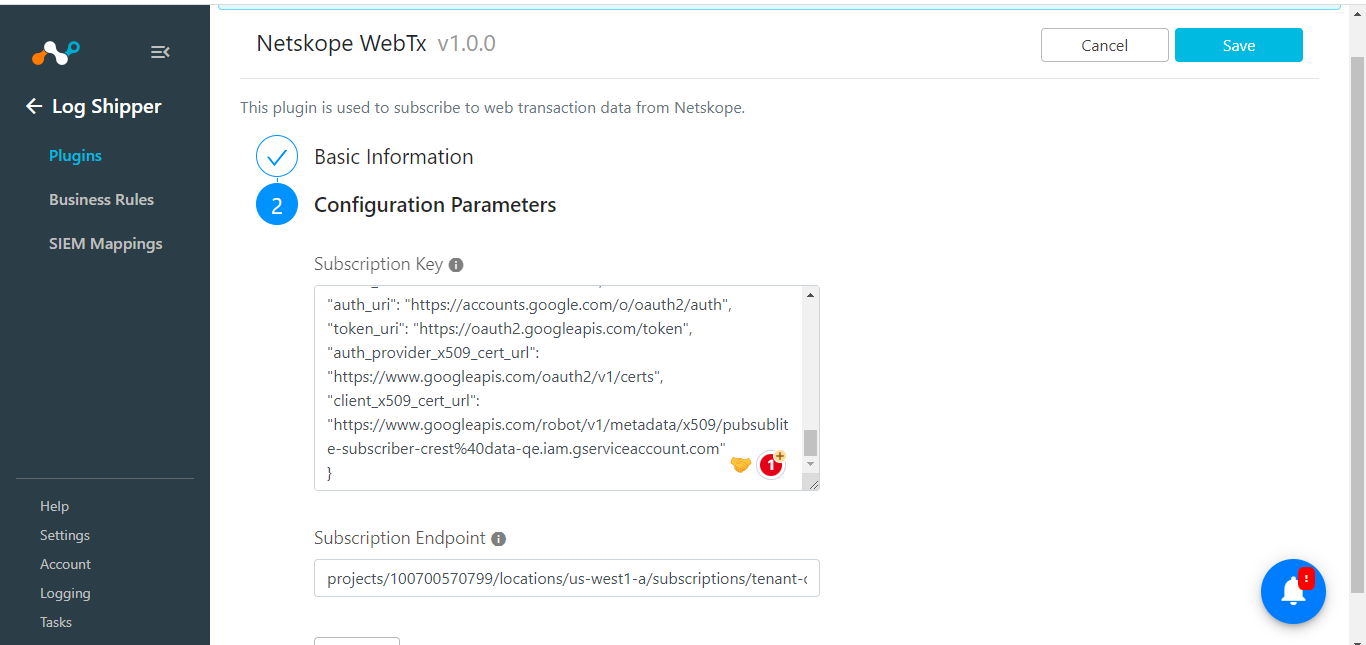
Your Subscription Key and Subscription Endpoint are needed to configure the WebTx plugin. To get your Subscription Key and Subscription Endpoint parameters, follow these steps.
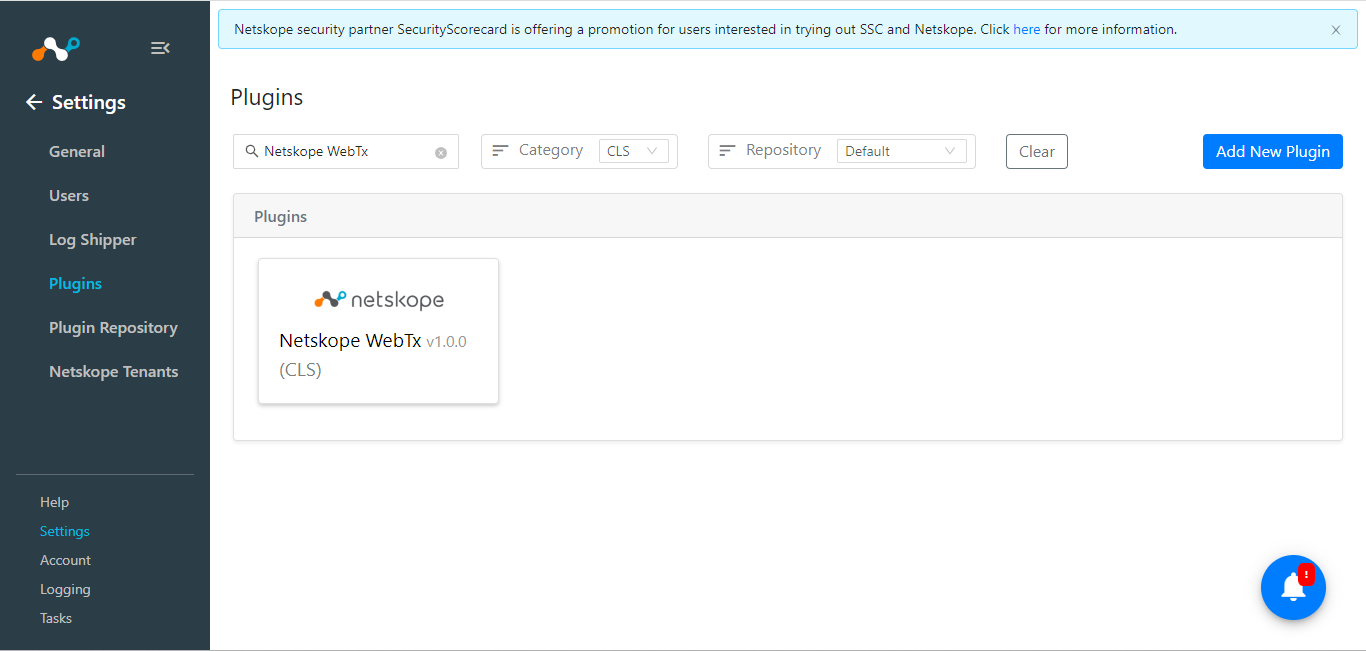
In Cloud Exchange, go to Settings > Plugins, and then search for and select the Netskope WebTx CLS plugin box.
Enter a configuration name and click Next.
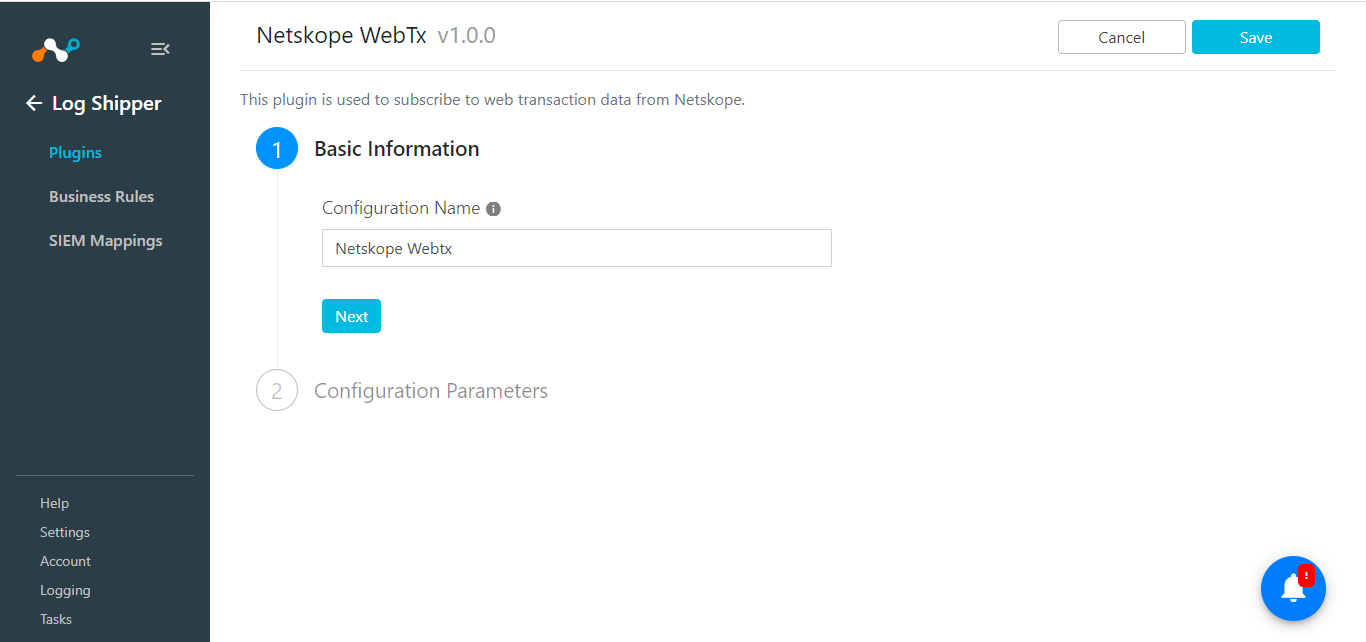
Enter your Subscription Key and Subscription Endpoint, and then click Save.
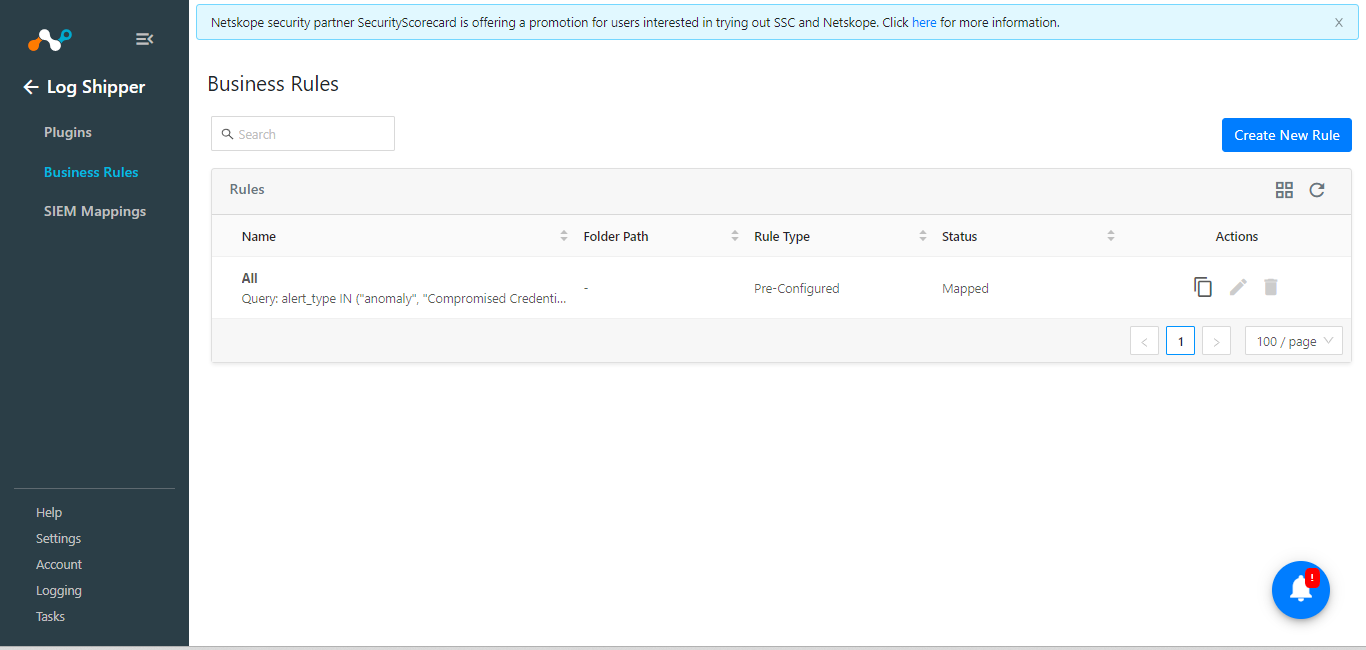
Go to Log Shipper > Business Rule. The default business rule filters all alerts and events. If you need to filter out any specific type of alert or event, click Create New Rule and configure a new business rule by adding a rule name and specific filters.
 |
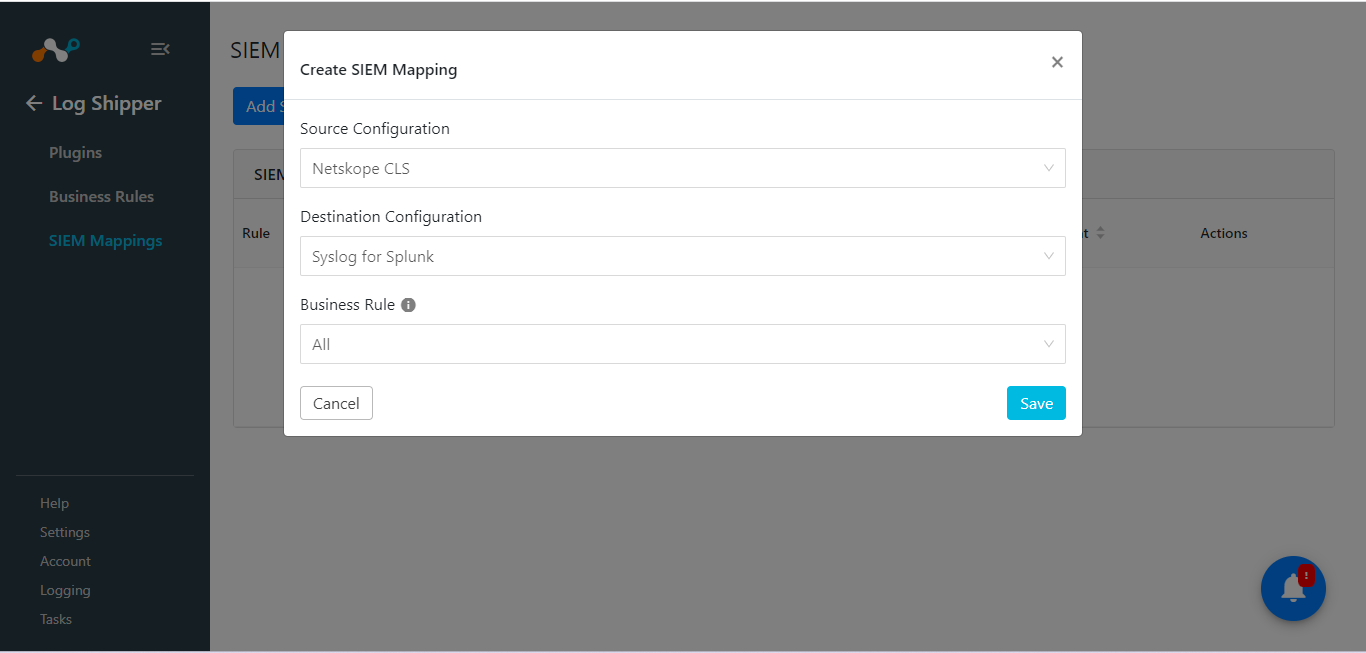
Go to Log Shipper > SIEM Mappings and click Add SIEM Mapping.
Select the Source plugin (Netskope CLS plugin), Destination plugin (Syslog plugin), and a business rule, and then click Save.
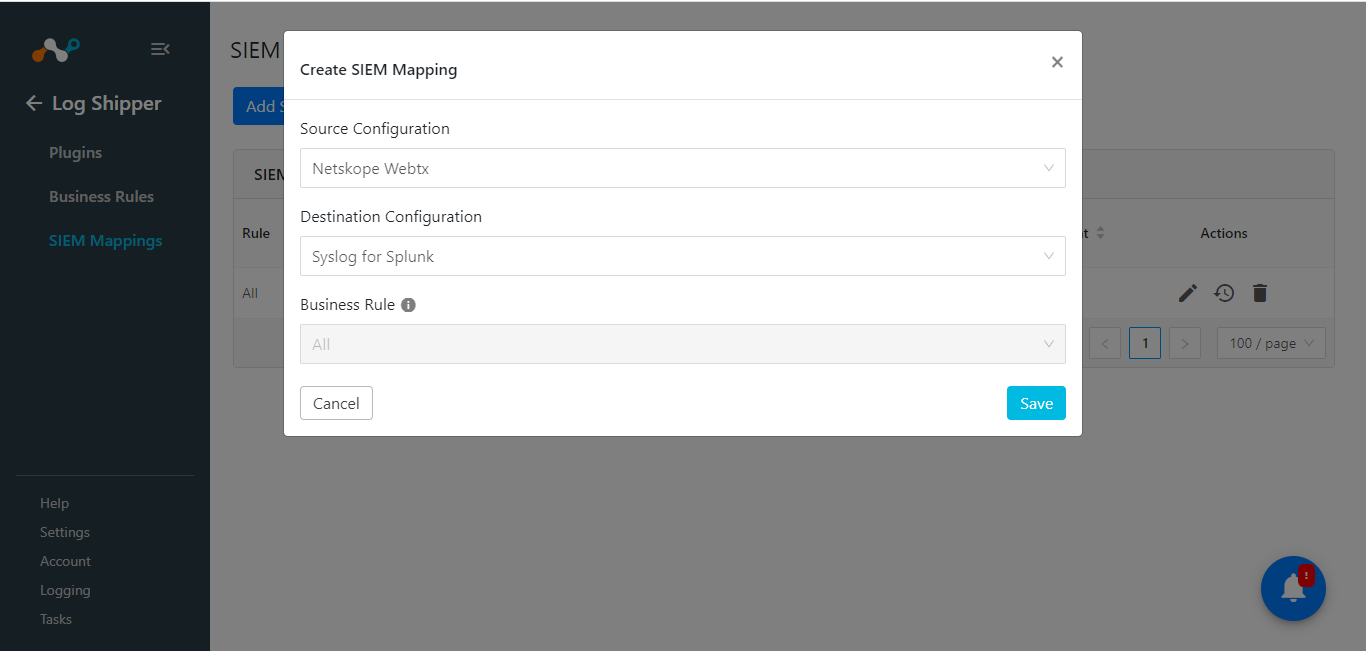
Click Add SIEM Mapping, select the Source plugin (Netskope WebTx plugin), Destination plugin (Syslog plugin), and a business rule, and then click Save.
In Cloud Exchange:
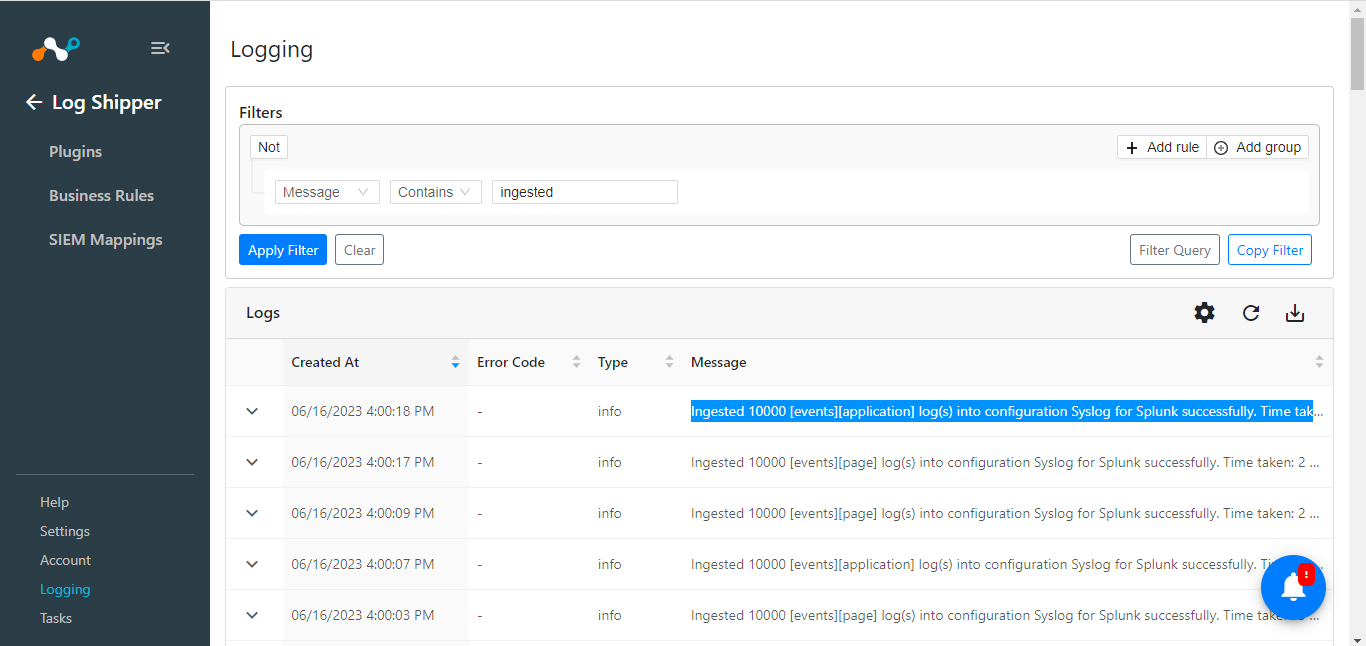
In Log Shipper, go to Logging.
Search for ingested logs with the filter <message Like "ingested”>. The ingested logs will be filtered.
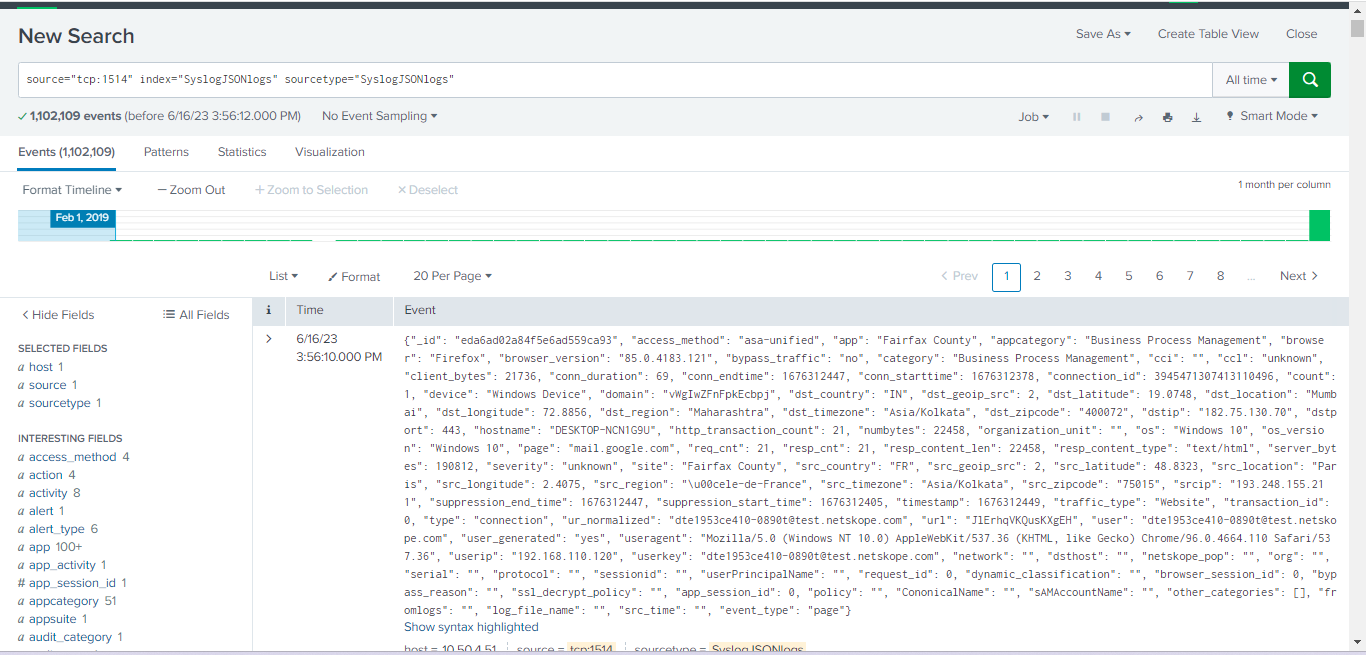
In Spunk:
On the Events tab in the Splunk UI (see screen below), click Search.
 |