About Network Events
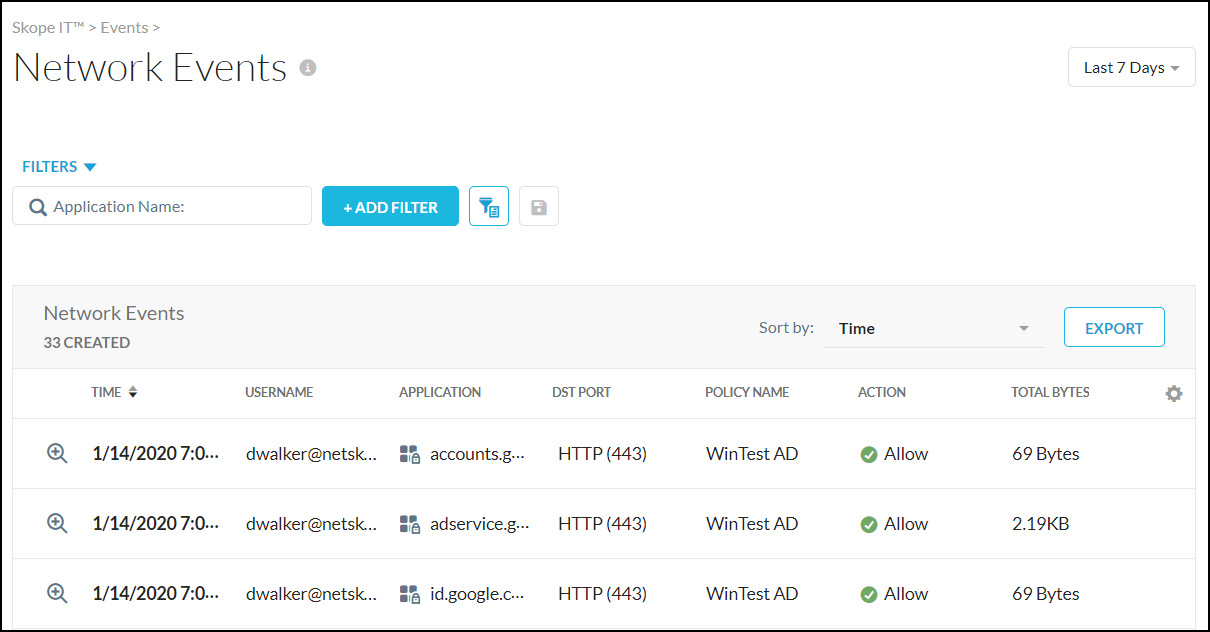
Network events enable you to monitor private app traffic and view relevant details, like who has access to what, from where, and for how long. To view Network Events, go to Skope IT > Events > Network Events.
 |
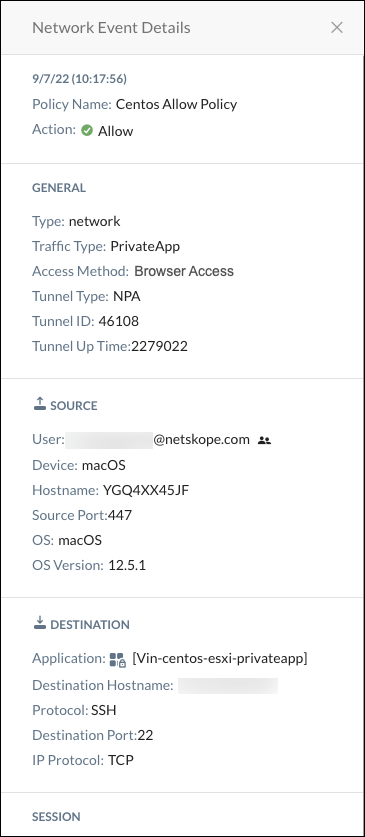
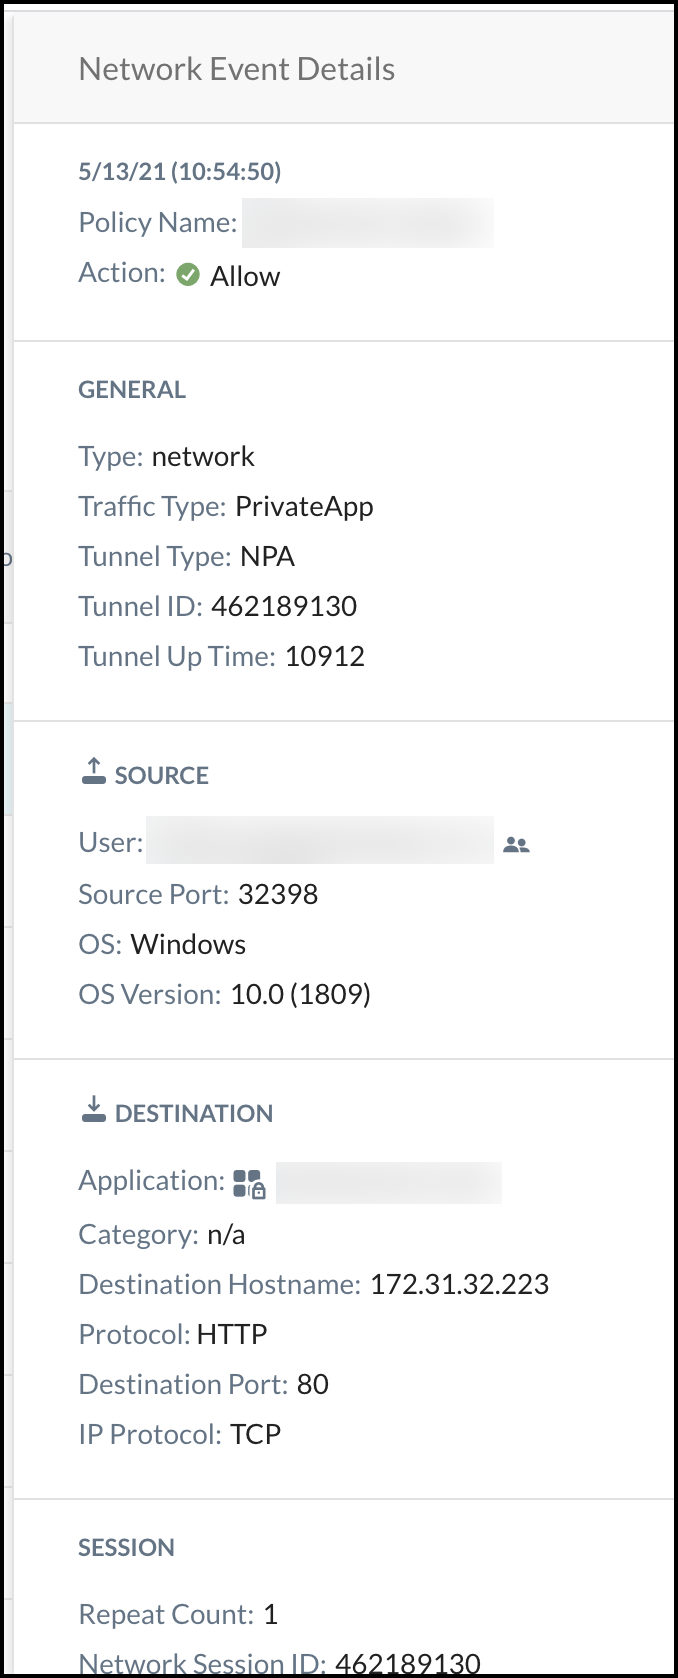
To view detailed information about a network event, click the  icon. Under General, Traffic Type (Private Apps), Access Method (Client or Browser Access), and Tunnel Type (NPA) are shown.
 |
This Network Events page has the following components:
Network Events table: Displays specified page events information. To change the information displayed, use the Customize Columns dialog box. Use the Sort By list in the table header row to arrange the listings in the table. Time is when the event occurred in the cloud platform.
Refresh Page button: To update the page with the most current information, click
 next to the page title.
Customize Columns dialog box: To customize the columns shown for each event, click
 located at the far right of the table column header row, and then select the columns you want to see. For more details, refer to Customize Columns below.
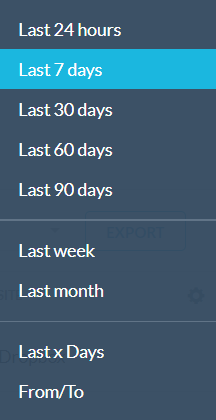
Date Range list: In the top right corner of the page is a date range filter. Click the toggle and select one of these date ranges.
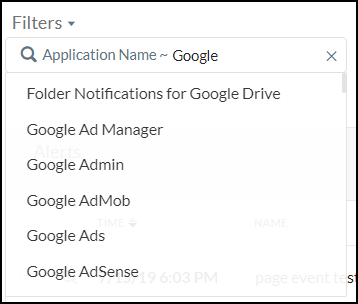
Application search filter: This search field helps you find applications and then filter results. Enter a name and then select from the list.
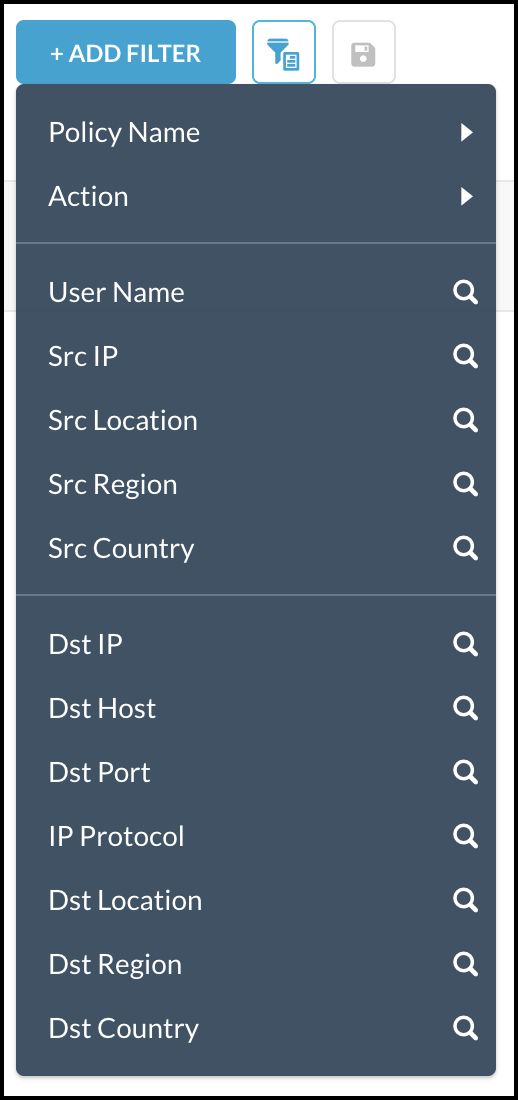
Add Filter lists: To create a filter, click + Add Filter, select what to include what to find in the search, and then click Apply.
Tip
You can choose multiple items for some options. The options with the
 icon allows you to search.
Save Filter button: After adding a filter, you can save it for future searches by clicking Save Filter.

Add to Watchlist button: To add filter values or query strings to a watchlist, click Add to Watchlist.

Query Mode button: Optionally, switch to query mode
 and enter a query in the search field. For example, to specify which app to search for, the domain, and the user's email address, enter the following query.
 app eq 'Google Drive' and instance_id eq '<yourcompany.com>' and user eq '<user@yourcompany.com>'
You can pin the query by clicking the pin icon
 to remember the query across the Application Events, Page Events, and Alerts pages.
To change back to the filter view, click Filter Mode.
Export button: Click Export to get the entire list of application events. First select the columns to export (those displayed, or specify which columns), and the number of rows, then click Export again. Your column and row selections are retained for future exports.
You will be sent an email with a link that allows you to download the list in CSV format.
Event Details button: Click the magnifying glass icon
 besides any listing to view more details about the page event. The default view shows the page events for the last 7 days unless you change the date range setting.
Rows per page list: At the bottom right corner of the page, the Rows per page list allows you to display 10, 20, 30, 50, or 100 rows per page.