Rapid7 Plugin for Log Shipper
This document explains how to configure your Rapid7 Insight IDR integration with the Log Shipper module of the Netskope Cloud Exchange platform. This integration allows fetching behavior scores of users from your Insight IDR instance.
Event Support | Yes |
Alert Support | Yes |
WebTx Support | Yes |
Logs Support | Yes |
All Netskope events, alert logs, and web transaction logs will be shared.
Note
Incident event type is supported from Core version 4.1.0.
CTEP alert type will be supported from Core version 4.2.0
The plugin uses a logging third-party library to push the data to the Syslog collector.
Refer to the official documentation for more information on the logging library: https://docs.python.org/3/library/logging.html
Logs Ingested | Time Taken |
9940000 | 2 hours |
To complete this configuration, you need:
A Netskope Tenant (or multiple, for example, production and development/test instances)
A Netskope Cloud Exchange tenant with the Log Shipper module already configured.
A Rapid7 Insight IDR instance.
A copy of your Rapid7 certificate.
Note
Verify your Rapid7 Insight IDR instance permissions are secure and not set up for open public access. Only allow access to your cloud storage instance from your Cloud Exchange Host and any other addresses that need access.
Get your Rapid7 server and port information.
Configure the Rapid7 plugin.
Configure Log Shipper Business Rules for Rapid7.
Configure Log Shipper SIEM Mappings for Rapid7.
Validate the Rapid7 plugin.
Click play to watch a video.
Go to your Rapid7 instance at https://insight.rapid7.com.
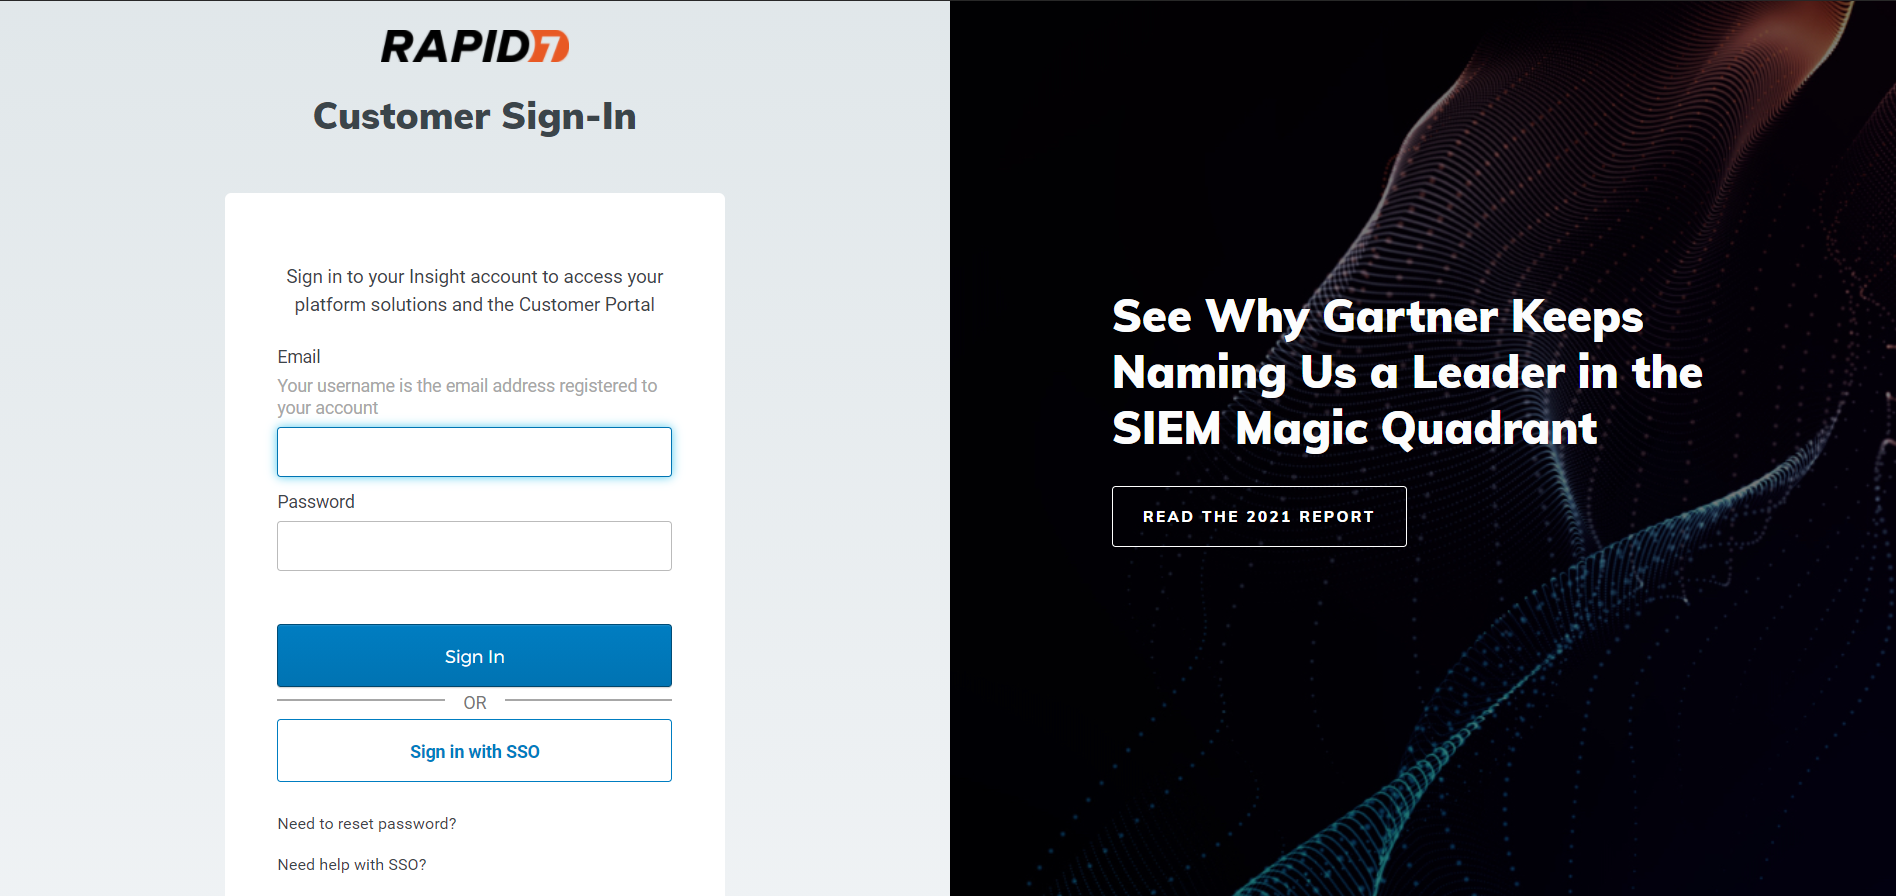
Log in to Rapid7.
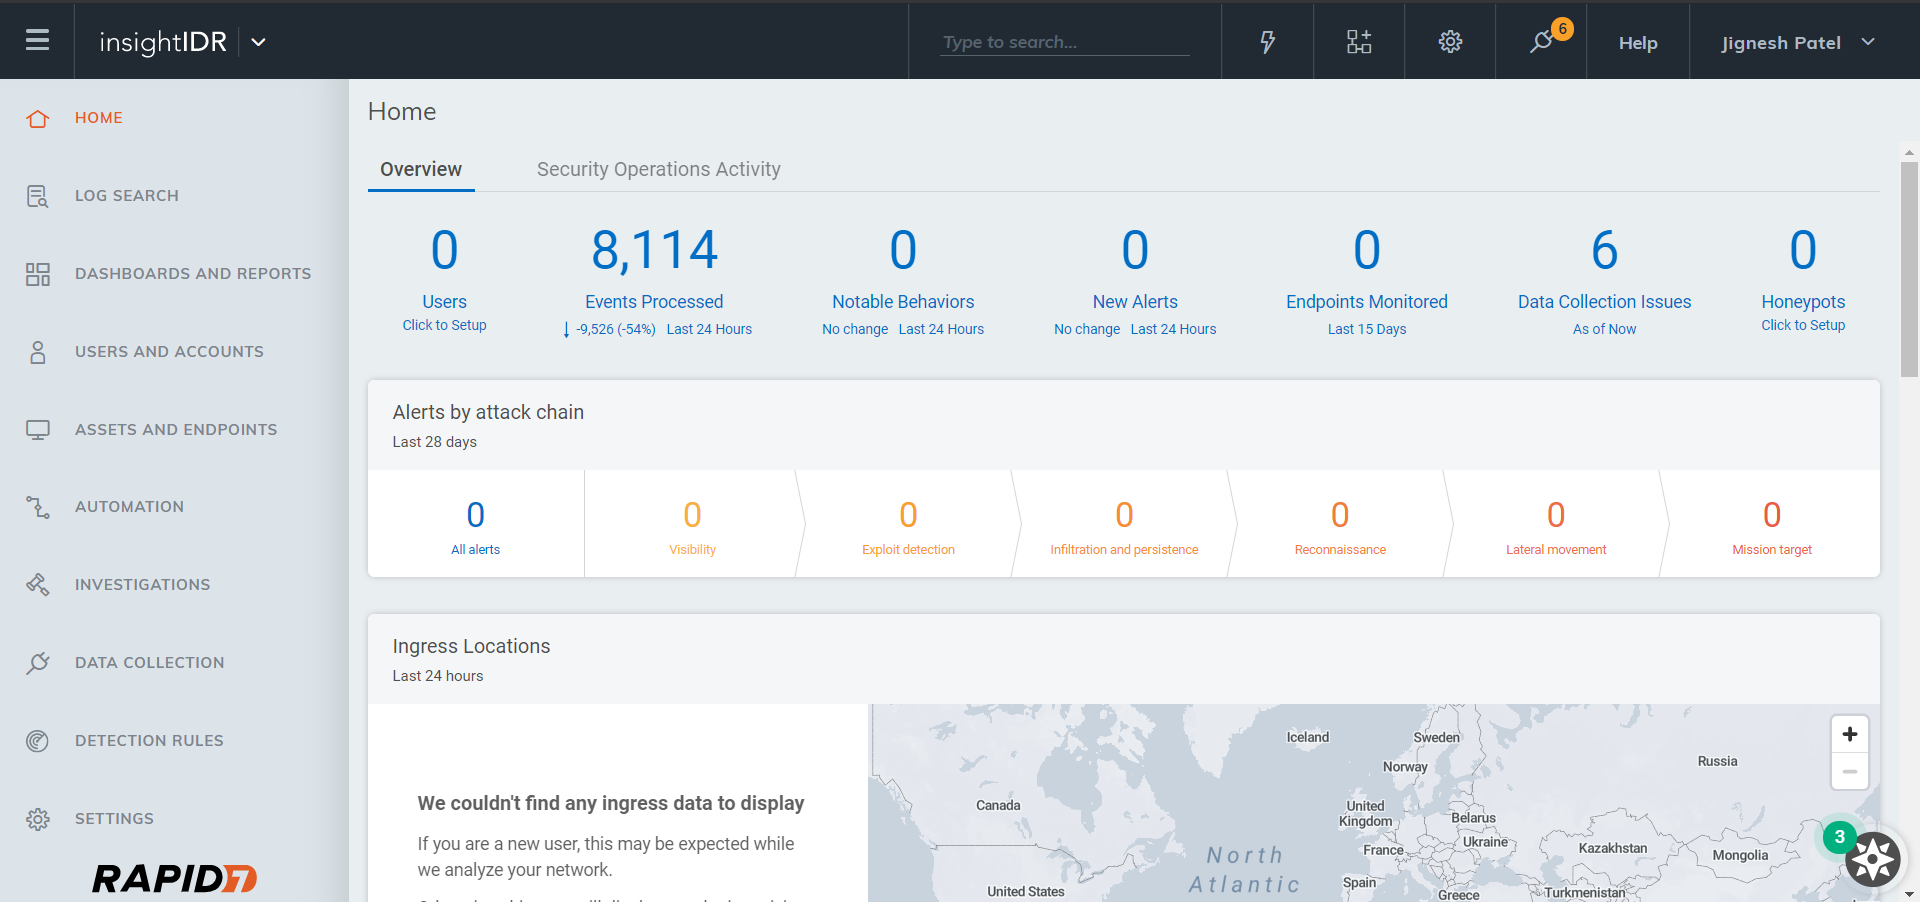
Click Data Collection, Collectors and then click Download Collector. Download the Collector for your OS.
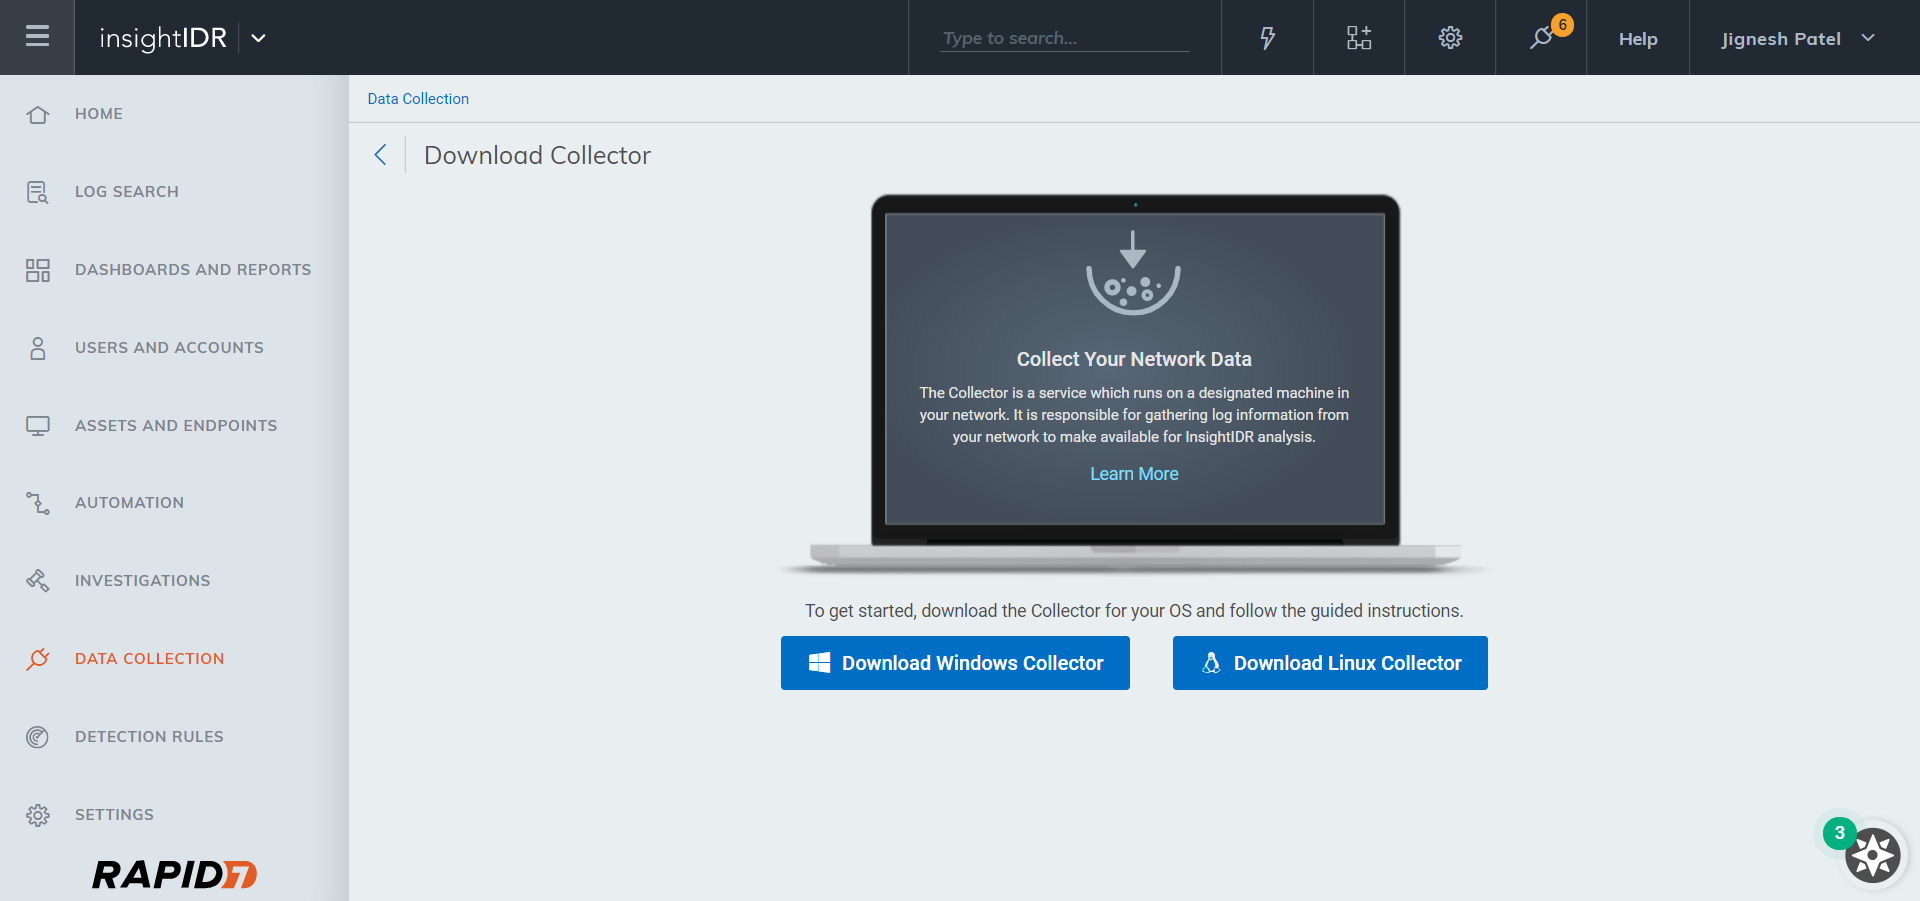
Install the Collector to your machine. (Installation Steps: Collector Installation and Deployment | InsightIDR Documentation)
Click Data Collection, Event Sources, and then click Add Event Source.
Scroll down and select Custom Logs.
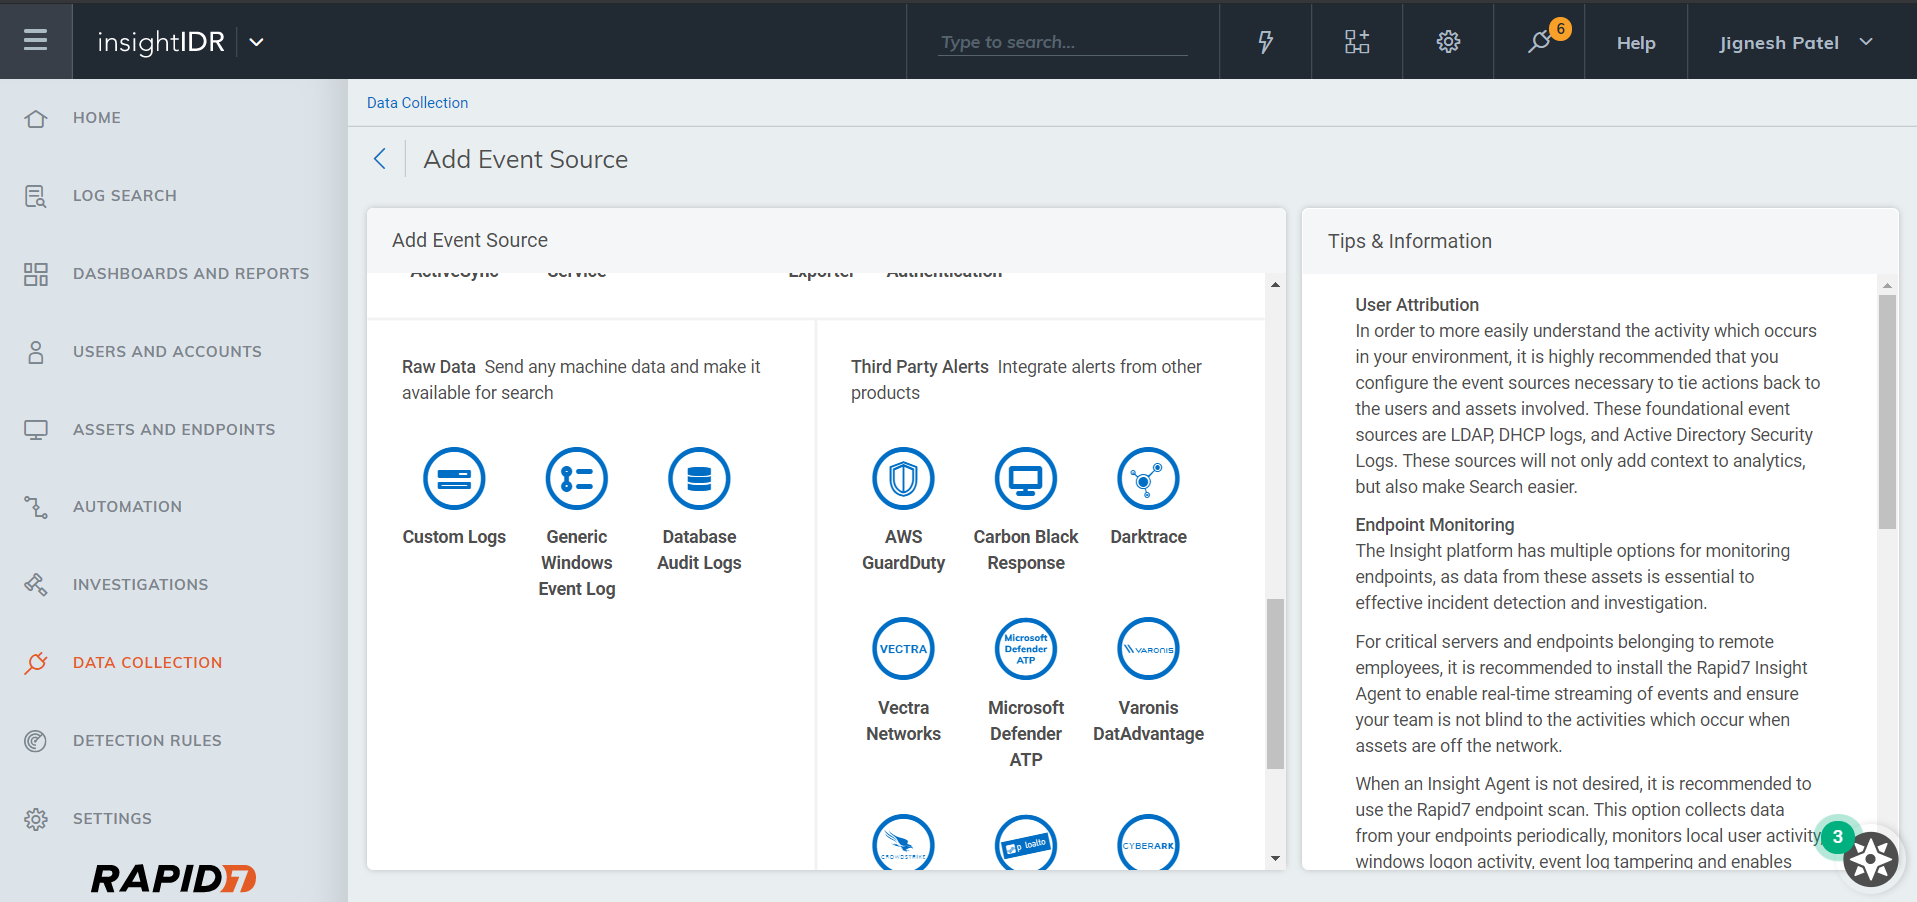
Select the Collector you activated. Enter a Name Event Source and select your Timezone.
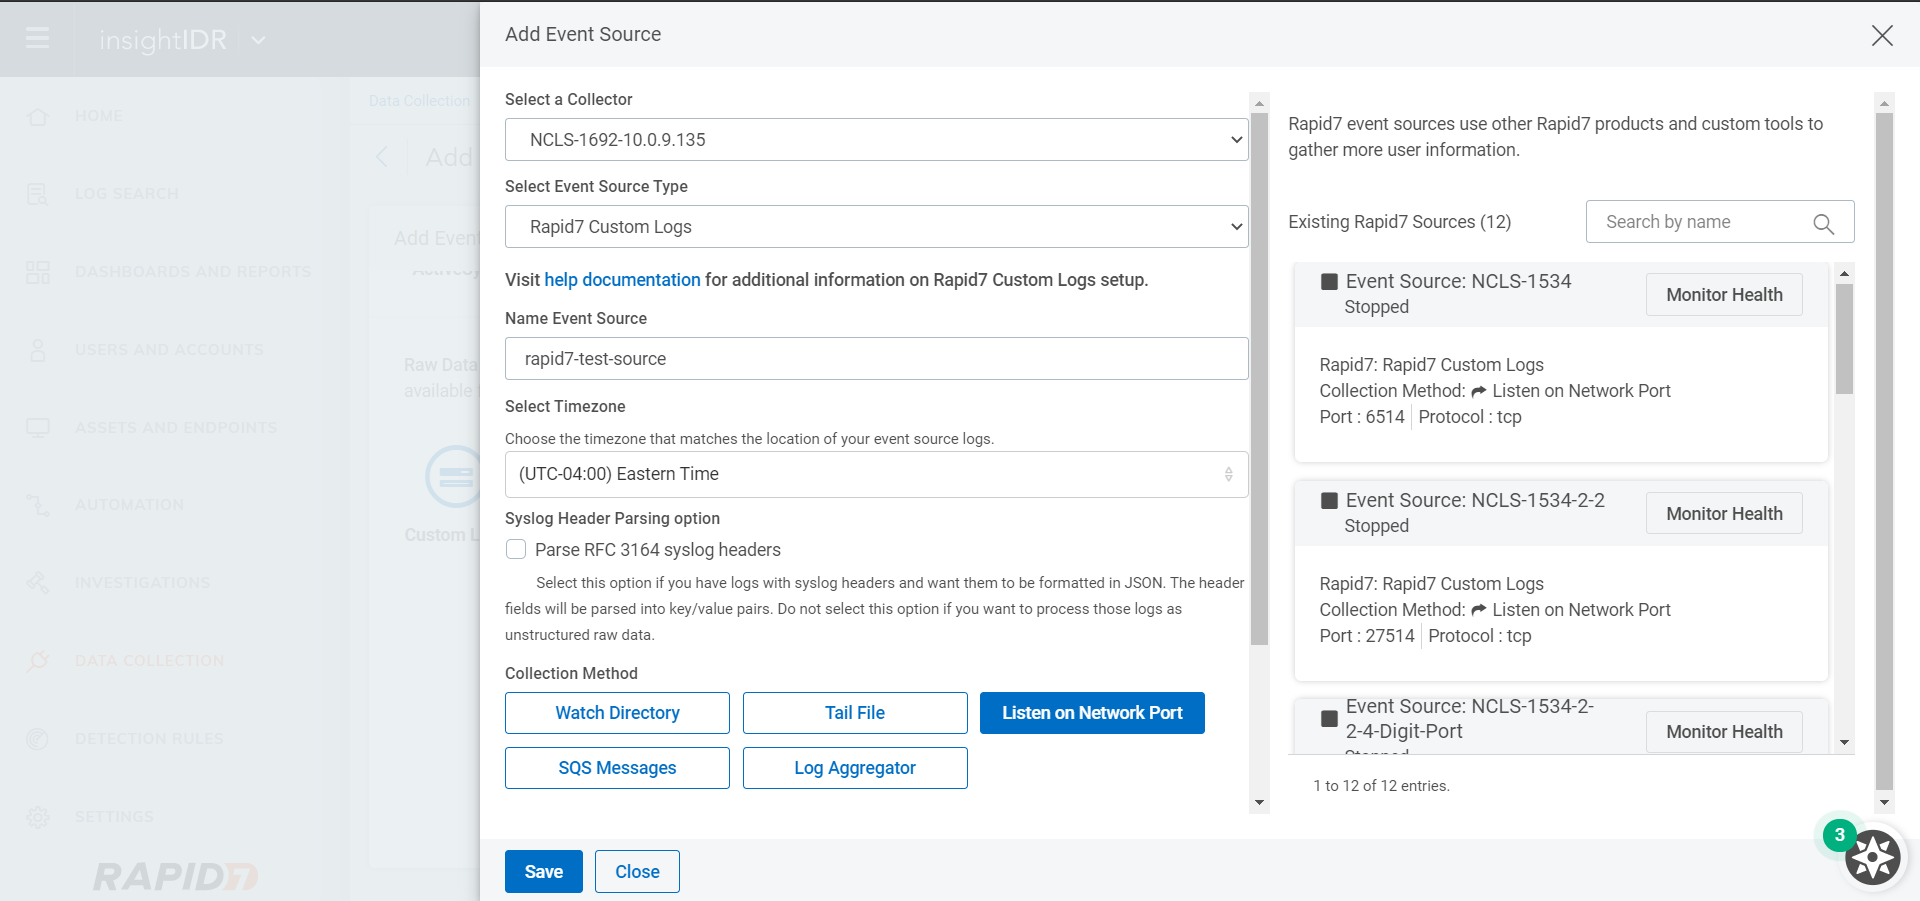
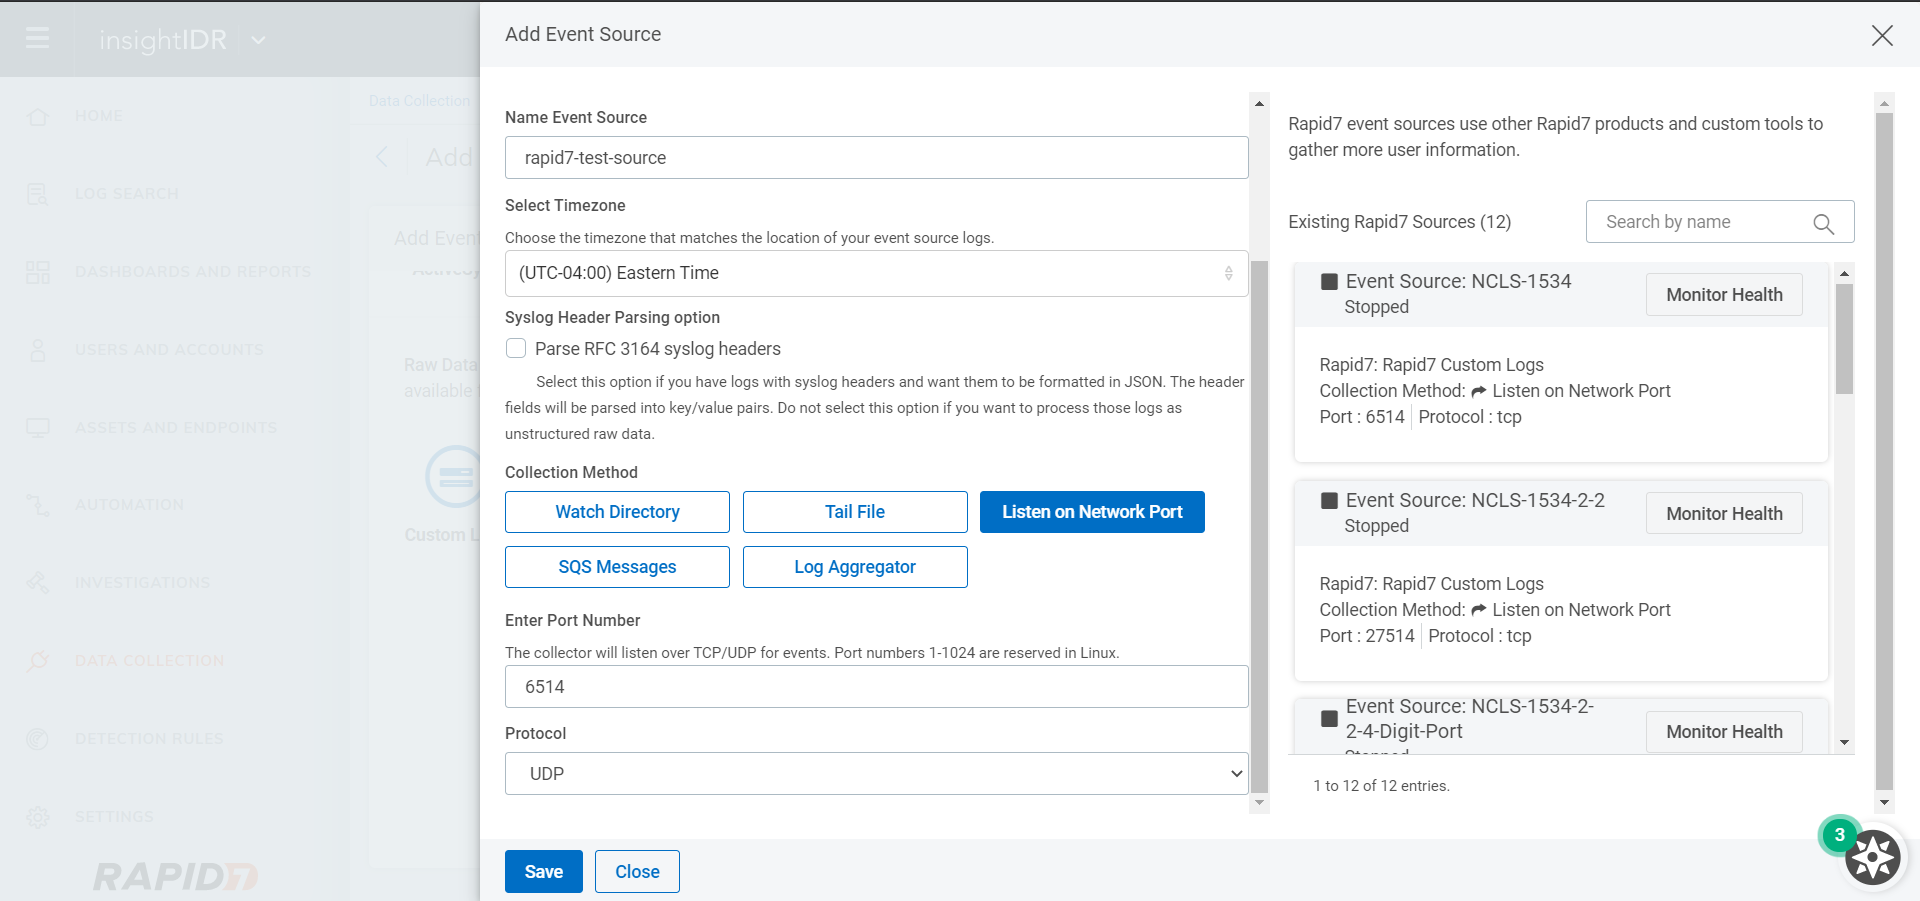
Click Listen on Network Port, enter a Port Number, and then select a Protocol.
Click Save.
Click Data Collection, and then Event Sources to see the configured Event source.
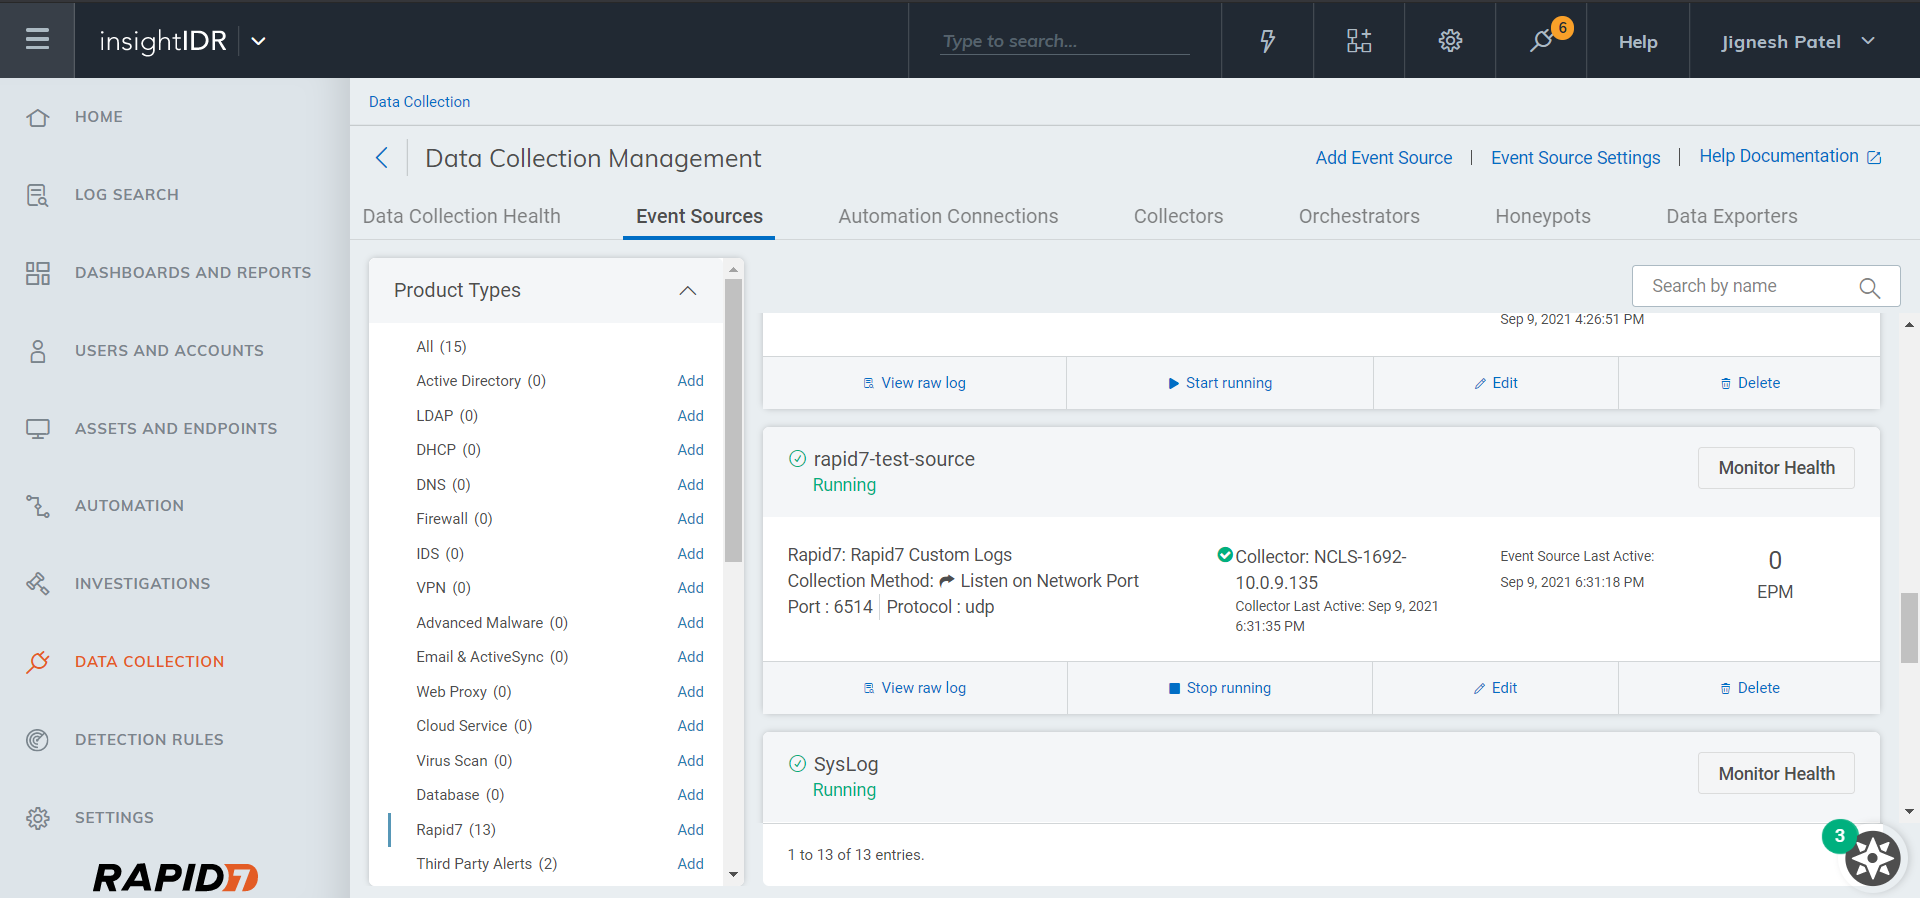
Make note of the server IP and port number.
In Cloud Exchange, go to Settings > Plugins.
Search for and select the Rapid7 box to open the plugin creation pages.
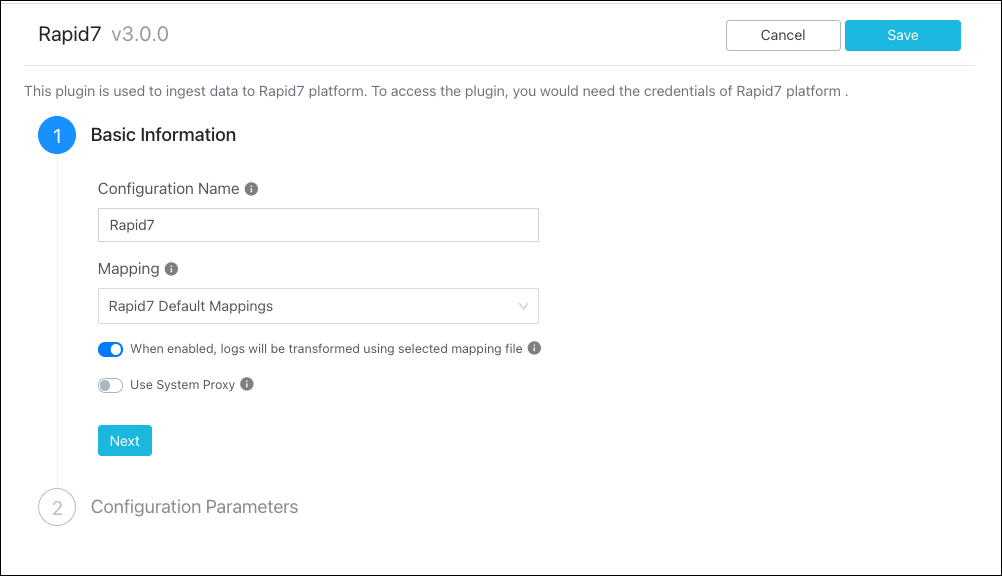
Enter a Configuration Name.
Select a valid Mapping or use the Default Mapping (available for all plugins).
Click Next.
Select and enter these parameters:
Rapid7 Server: IP address/FQDN of Rapid7 server in which data will be ingested.
Rapid7 Format: Data format required to ingest data.
Rapid7 Protocol: Protocol to be used while ingesting data.
Rapid7 Port: Configured Event Source port on Rapid7.
Rapid7 Certificate: The certificate is required only for TLS protocol.
Log Source Identifier: The prefix to be added for the logs.
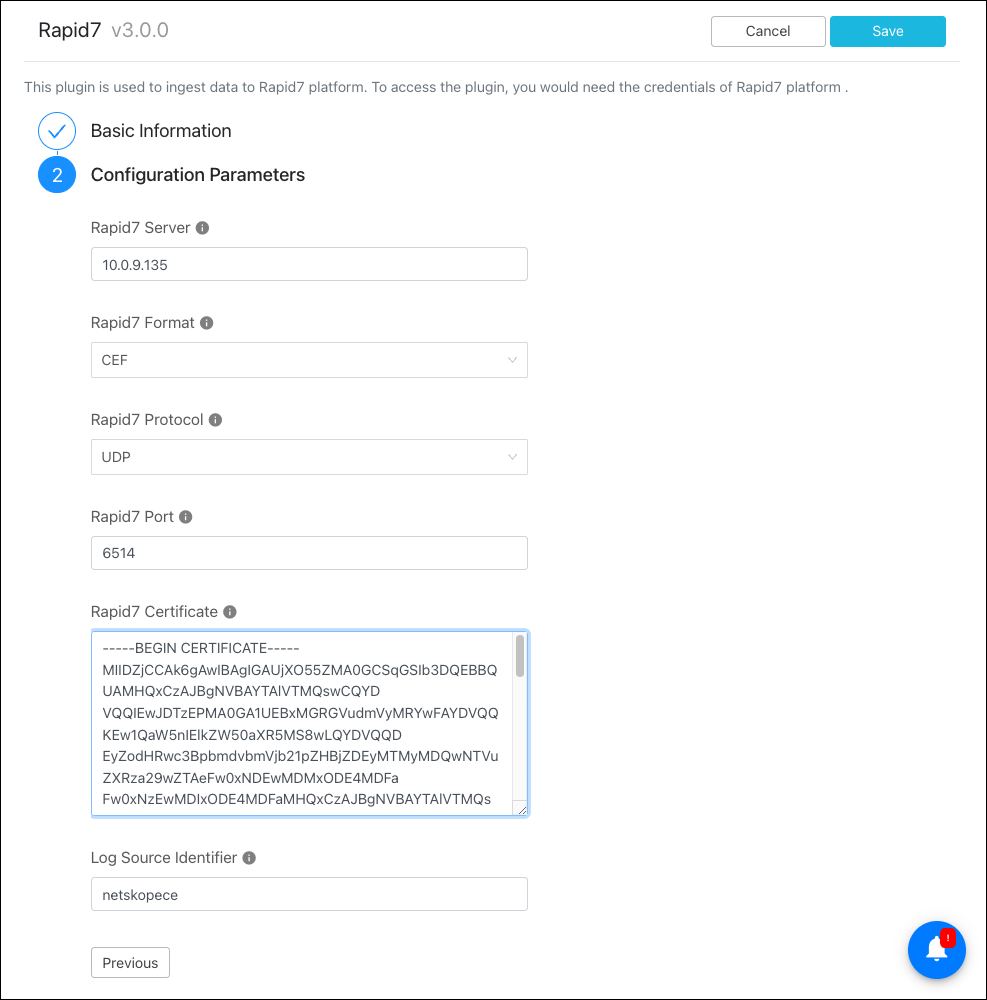
Click Save.
Go to Log Shipper > Business Rules.
Click Create New Rule.
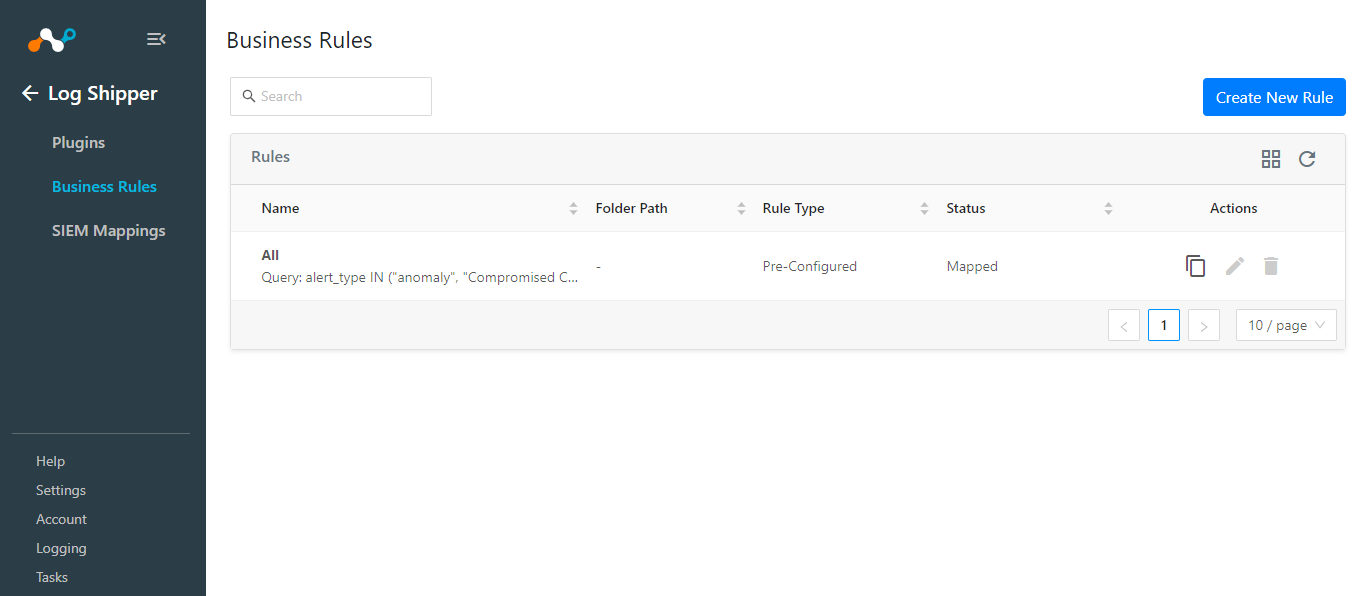
Enter a Rule Name and select the filters to use.
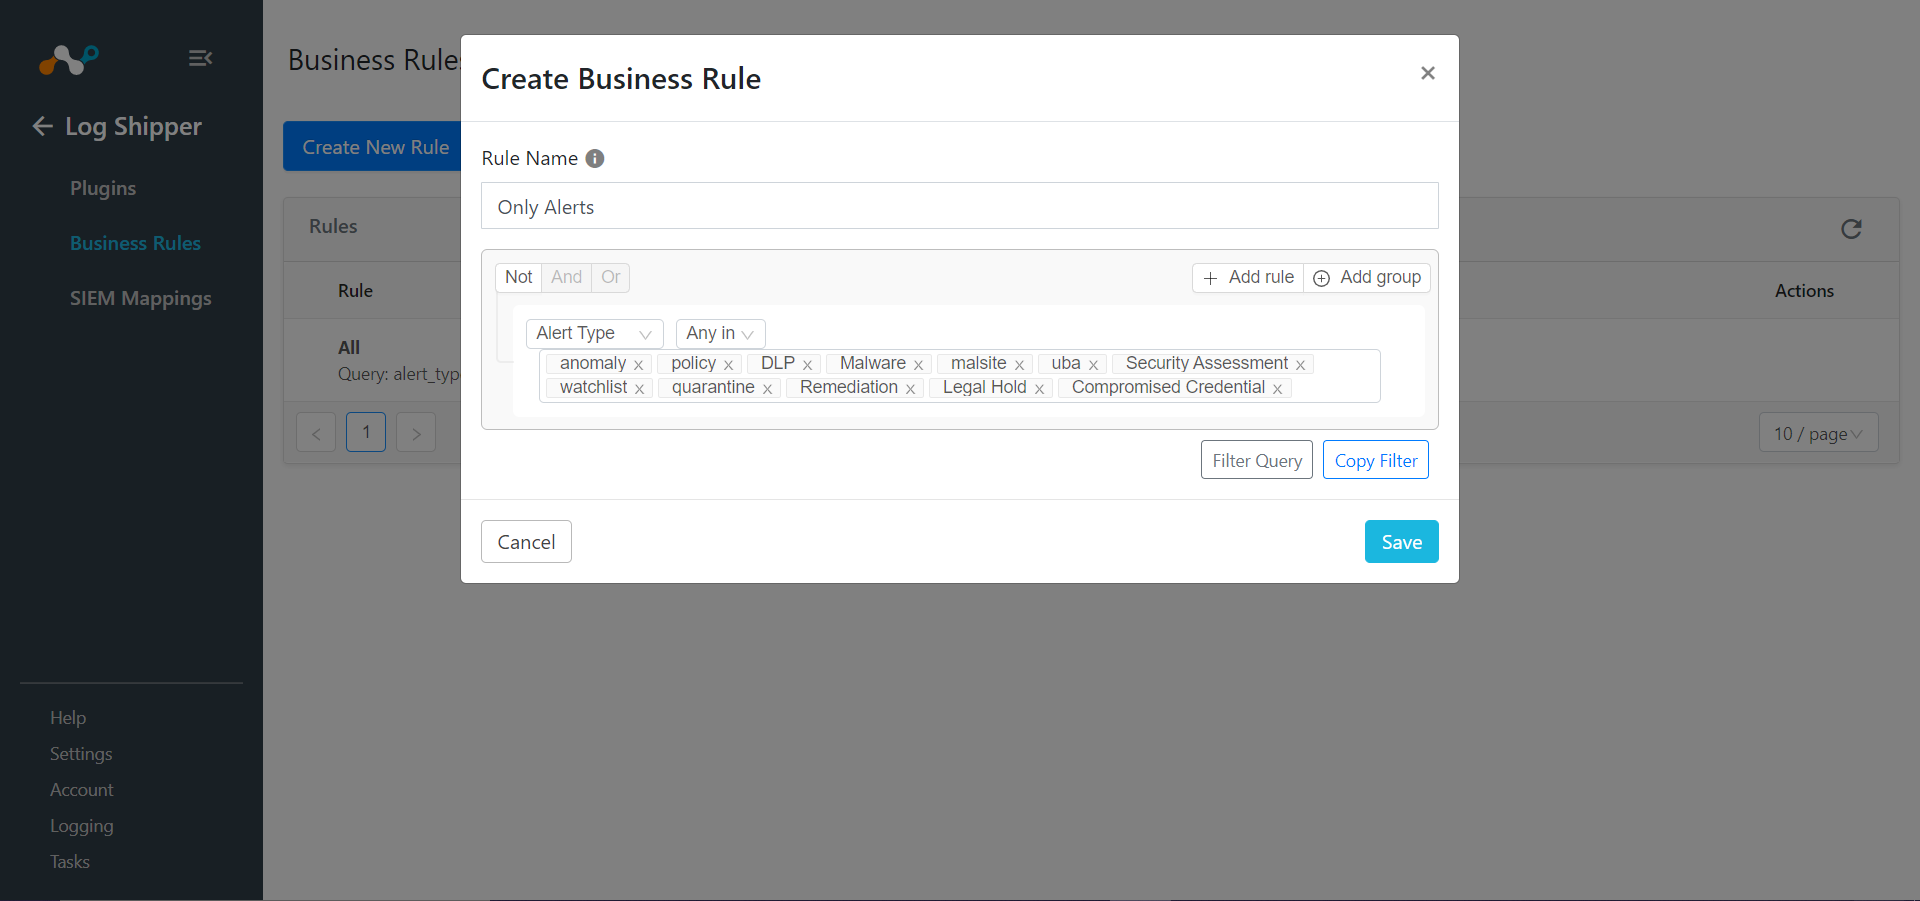
Click Save.
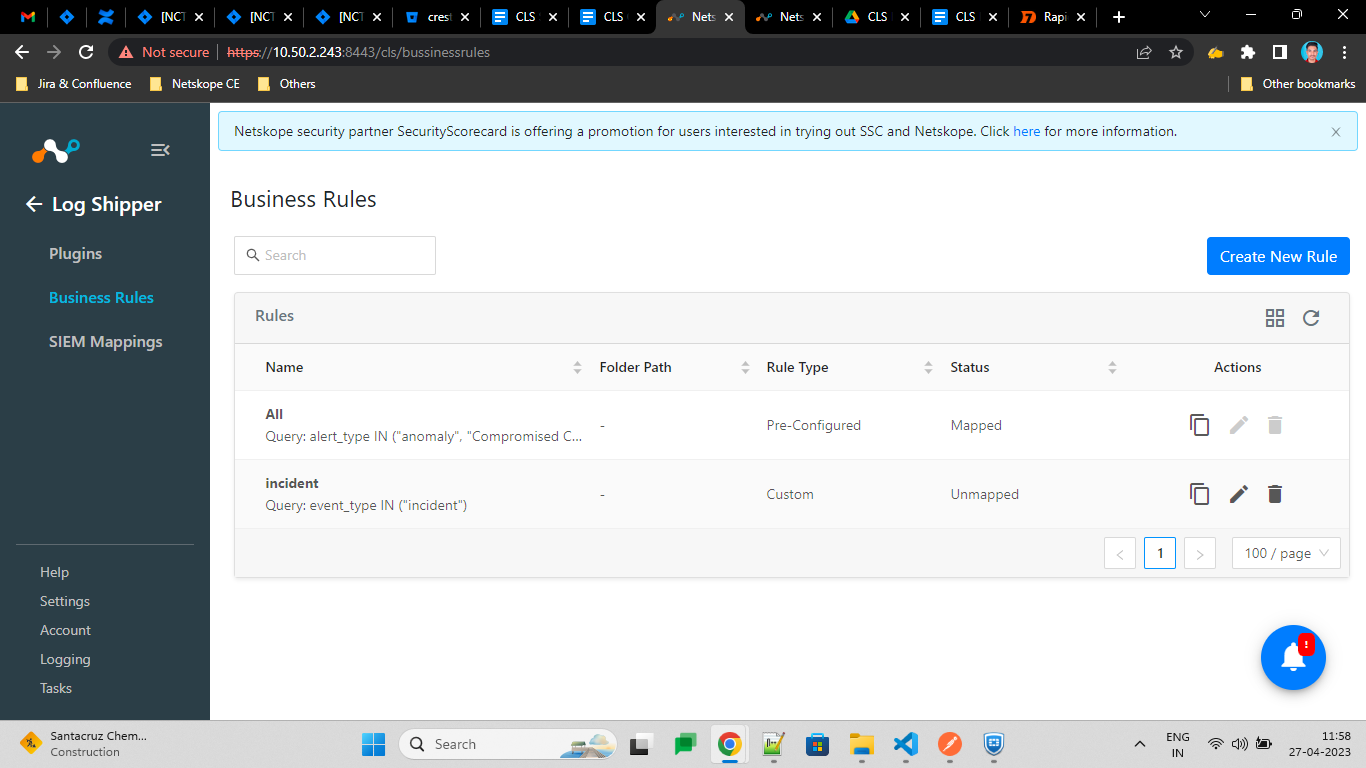
Go to Log Shipper > SIEM Mappings and click Add SIEM Mapping.
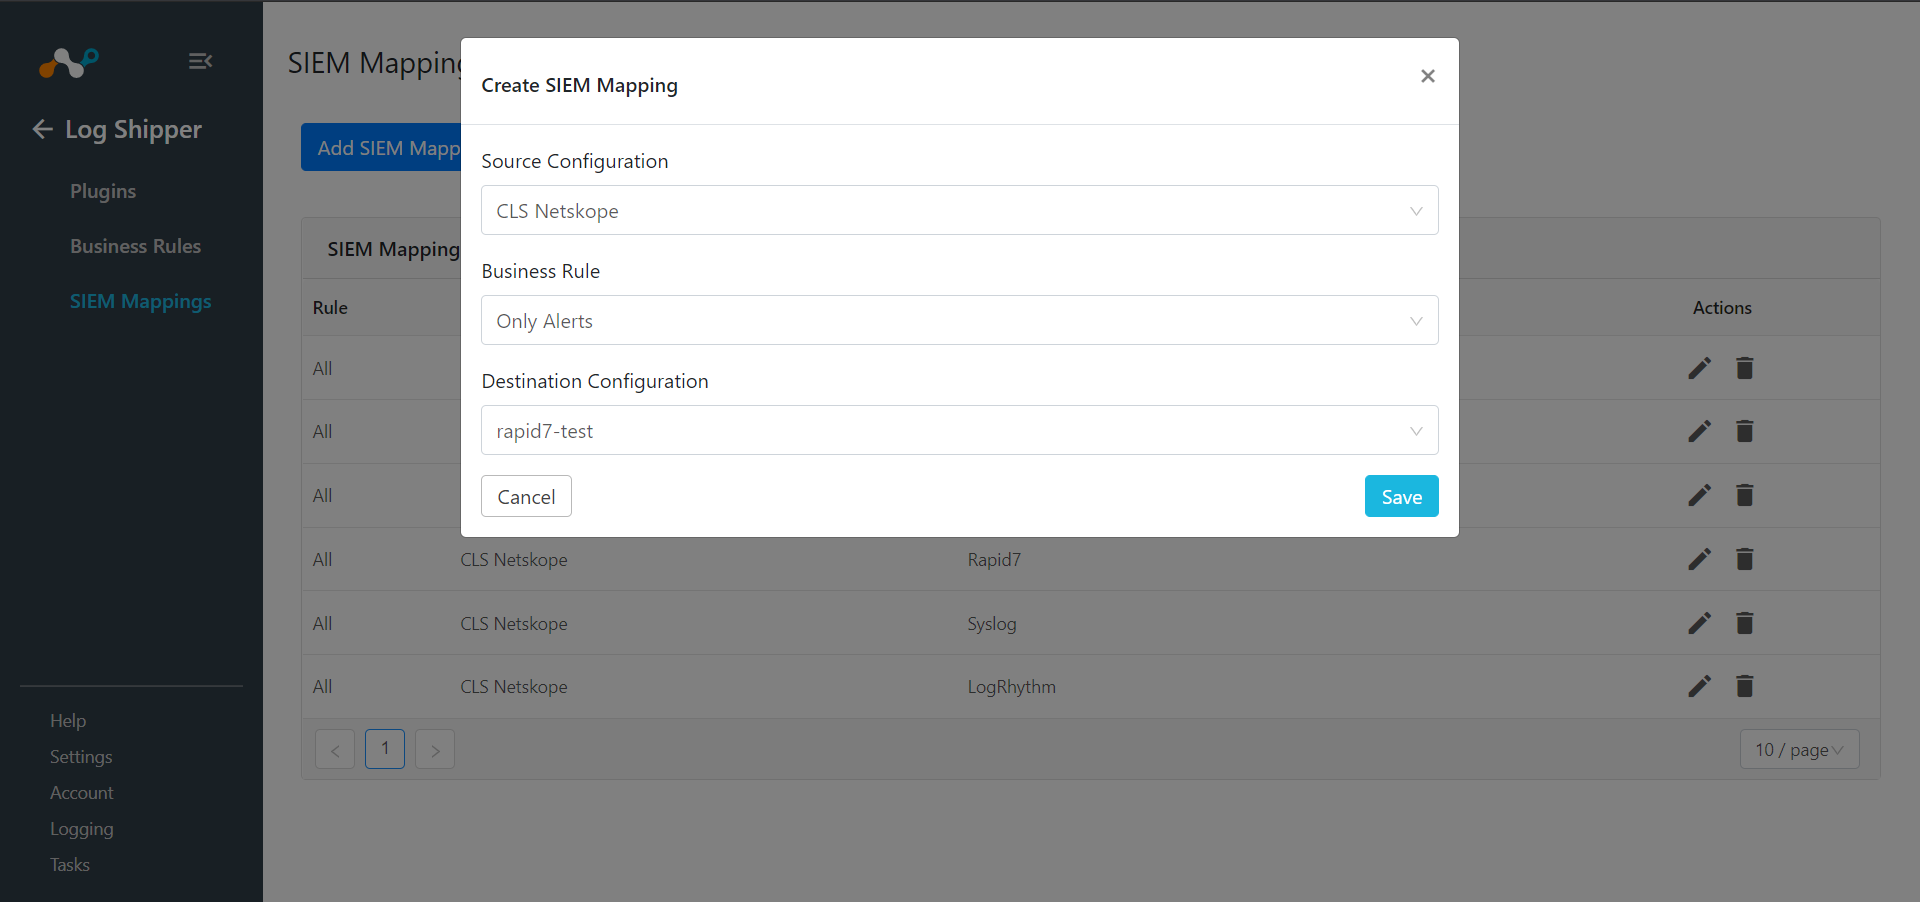
Select a Source Configuration, Business Rule, and Destination Configuration.
Click Save.
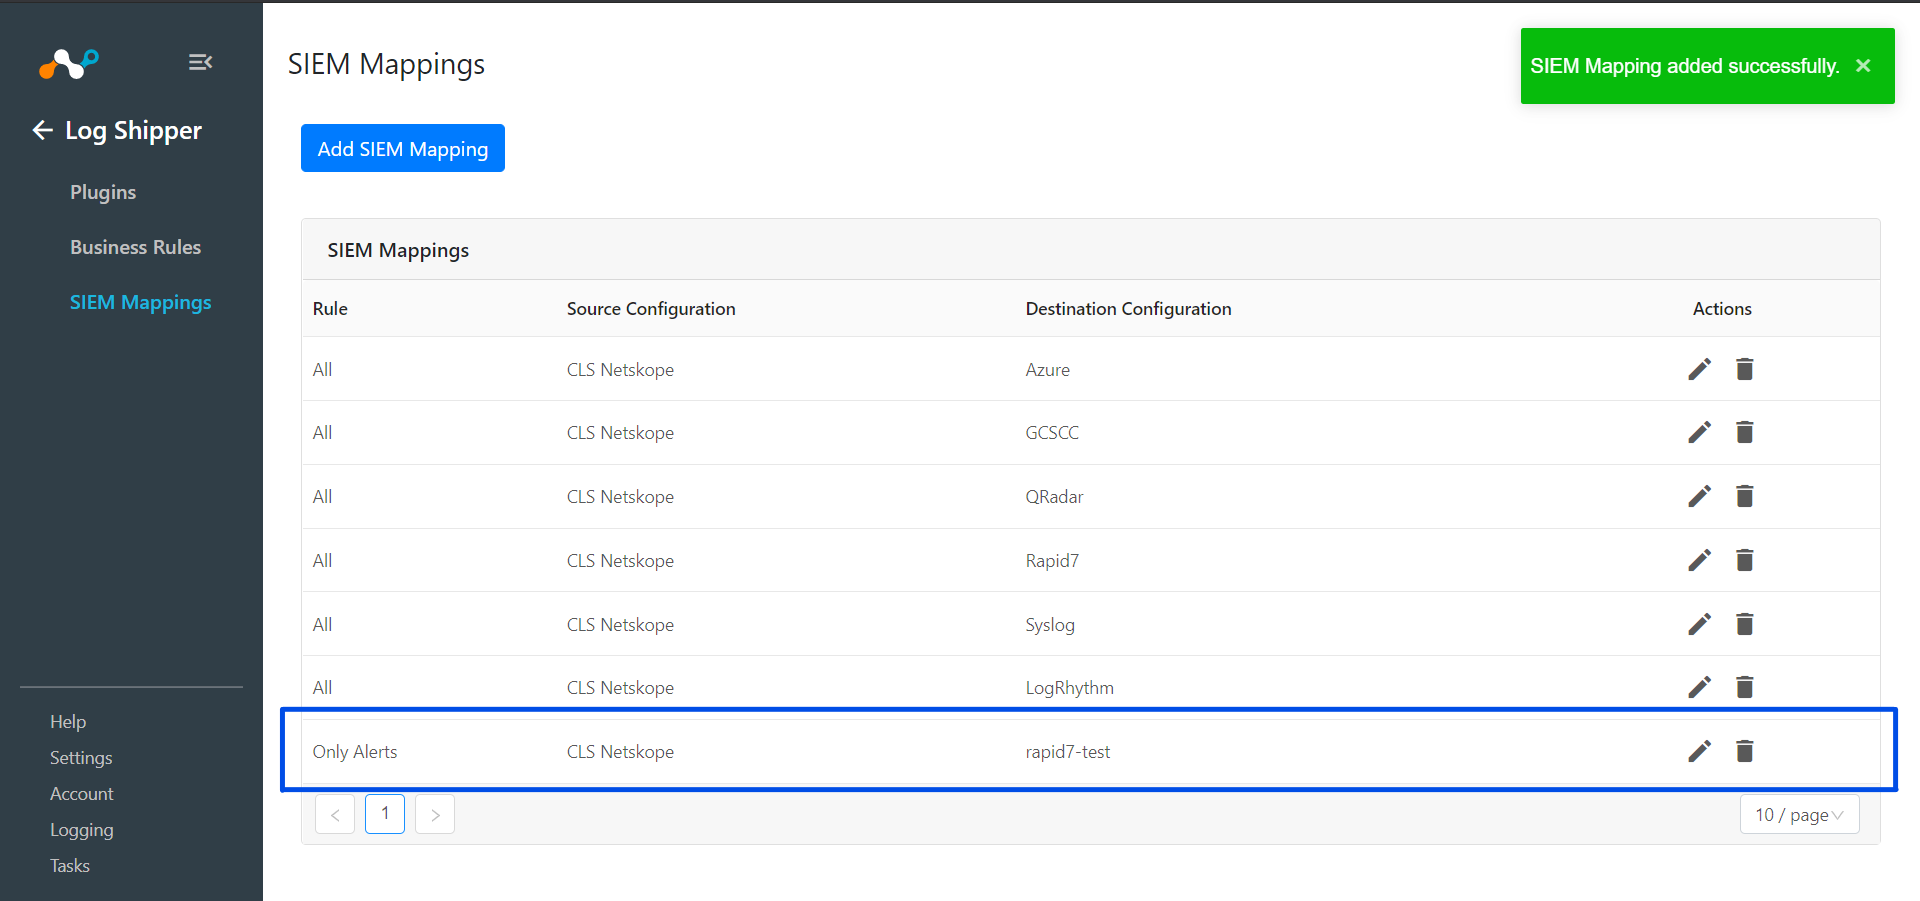
To validate the plugin workflow, you can check from Netskope Cloud Exchange and from Rapid7 instance.
To validate from Netskope Cloud Exchange, go to Logging.
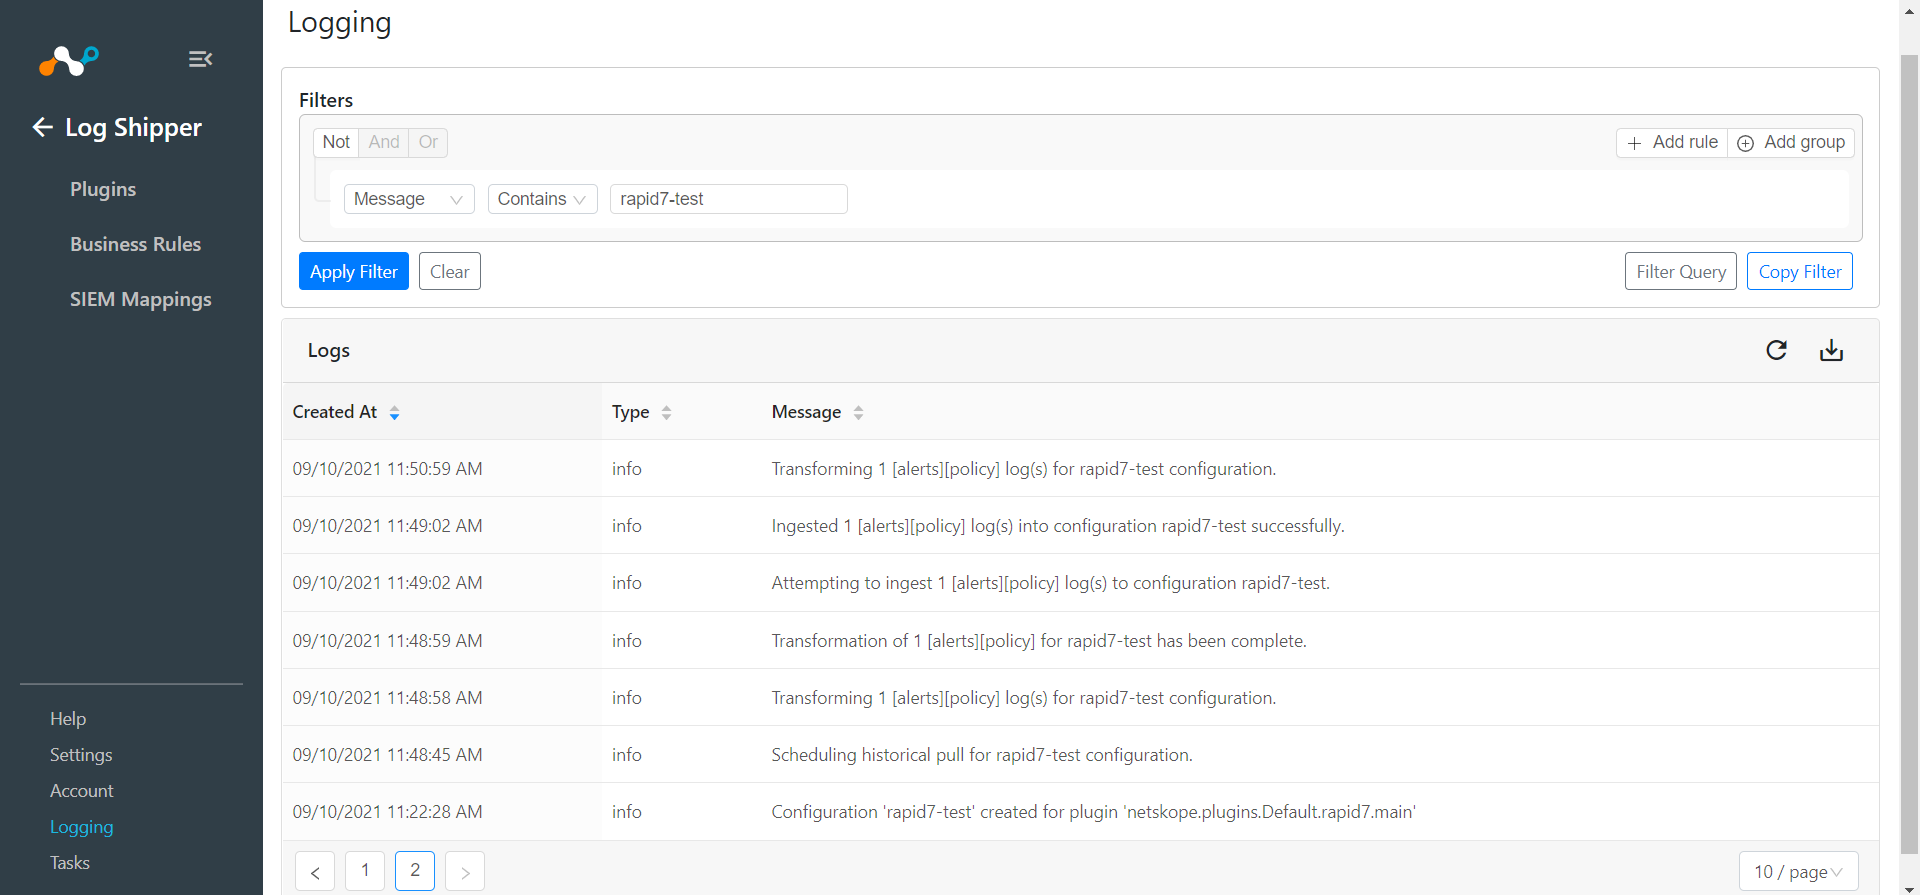 |
To validate from the Rapid7 instance:
Go to Log search and select your Log Source.
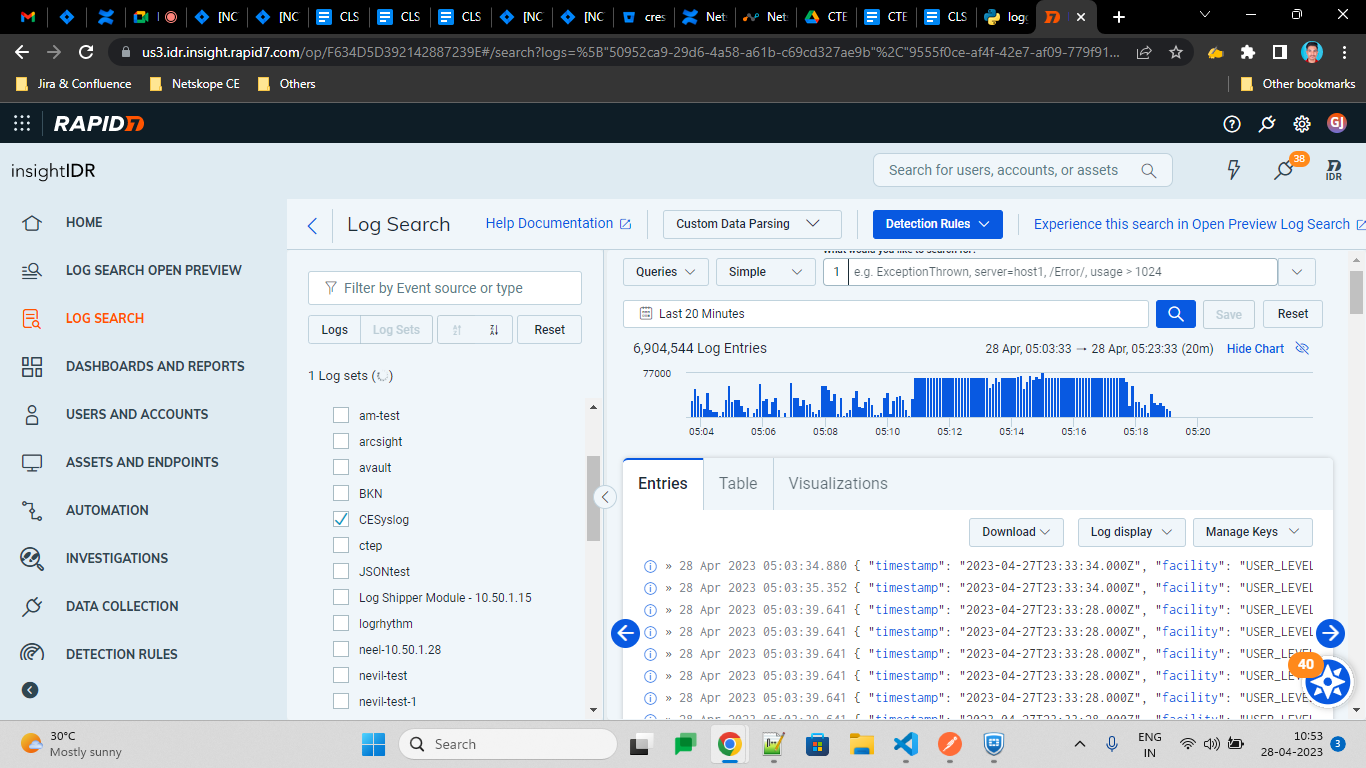
You’ll see logs here. You can add a filter to see data for specific time range, by default it would be displaying logs for last 20 minutes.
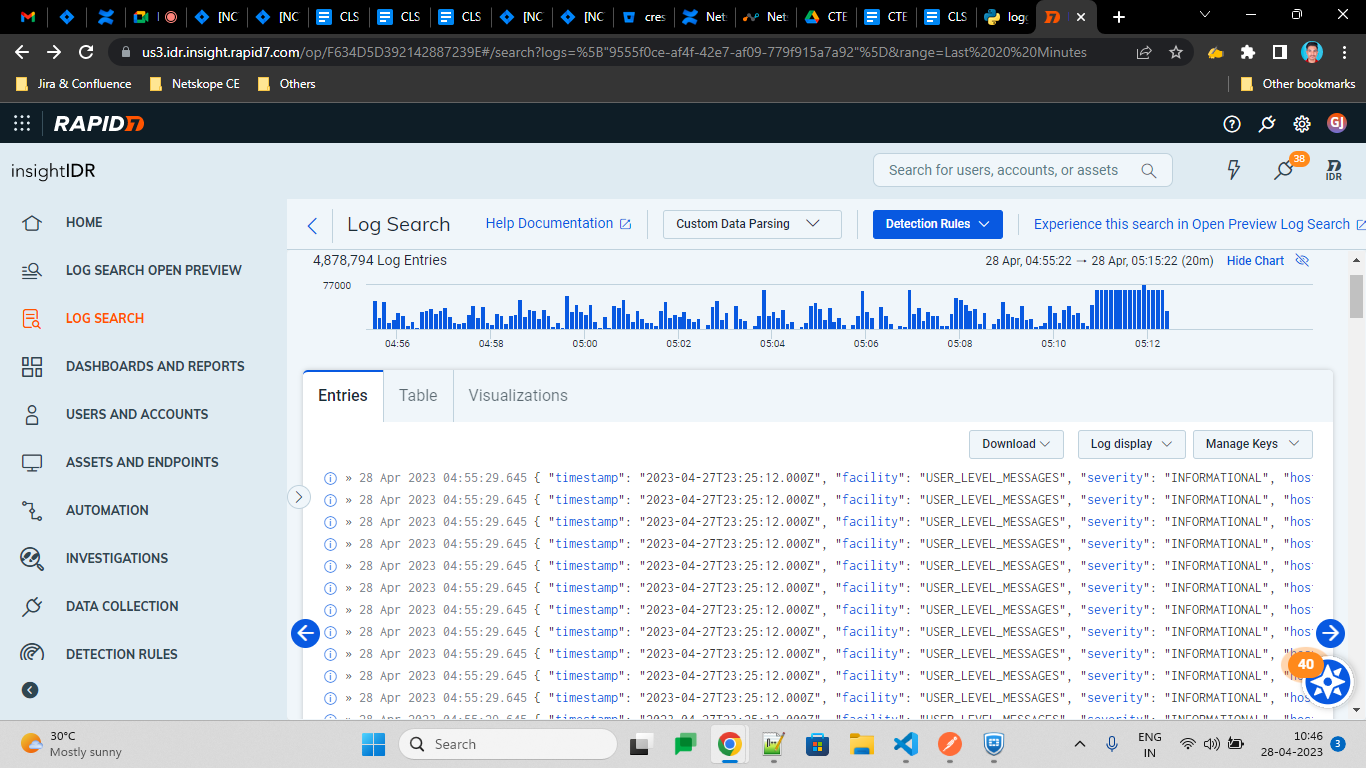
Note: It will take few mins to reflect the ingested data.