Behavior Analytics Incidents
To access the Behavior Analytics page, go to Incidents > Behavior Analytics. Admins can view this page and act on the Unacknowledged incidents.

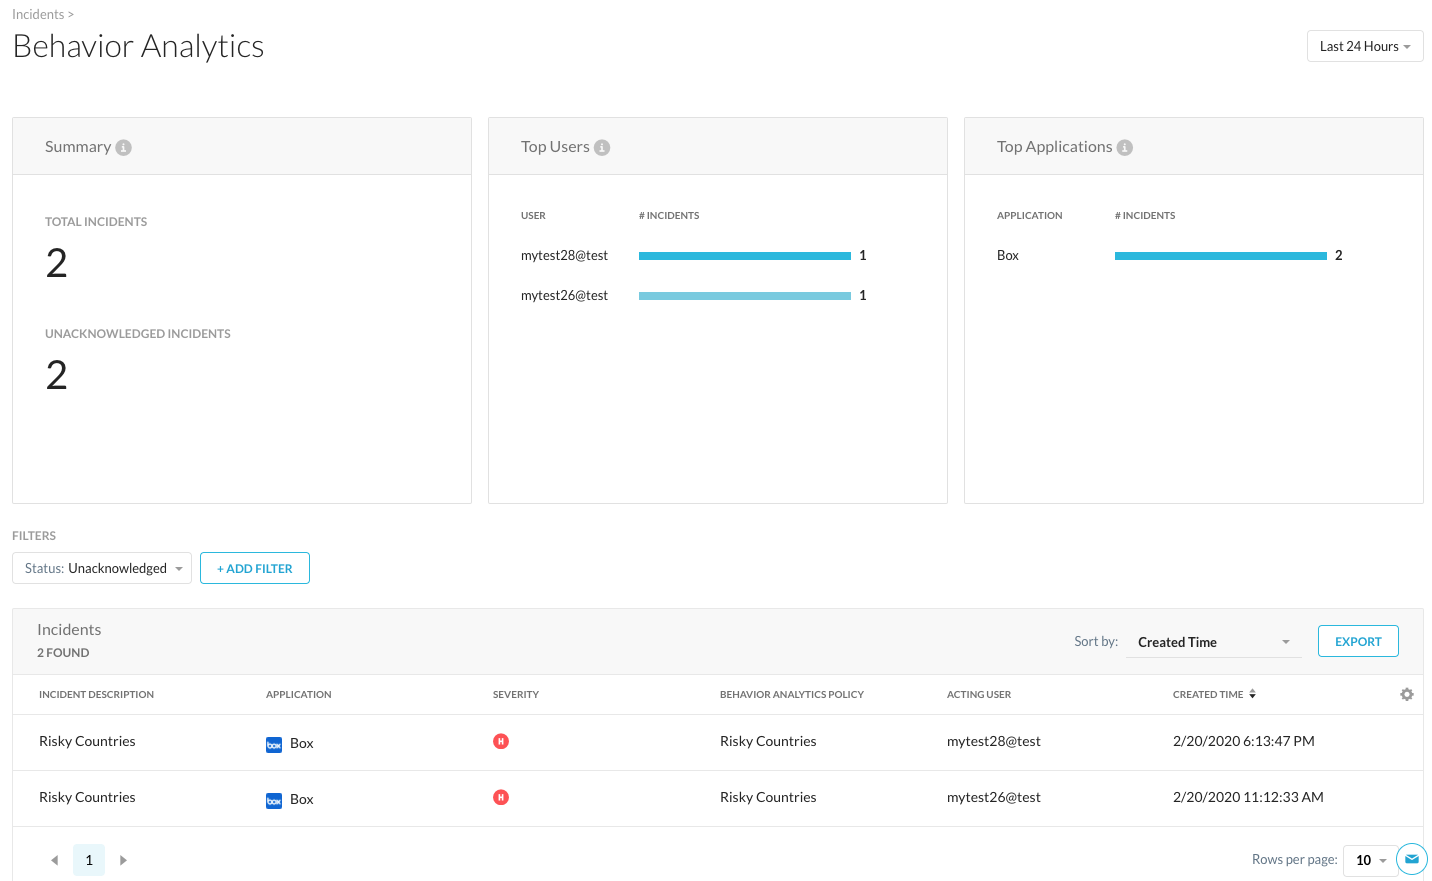
Primary metrics appear in the panels on top, and a table view provides more specific information. The information shown on this page includes:
Summary: Lists the total number of incidents and unacknowledged incidents.
Top Users: Lists the users in your organization and the total number of associated incidents.
Top Applications: Lists the applications with the highest incident rates.
Incident Description: List a short description of the incident that triggered the policy. Click the Incident description name to view the Behavior Analytics Incident details page.
Application: Lists the application name that is involved with this incident.
Severity: Lists the severity of the incident as determined by the policy enabled.
Behavior Analytics Policy: Lists the policy you enabled that triggered the incident.
Acting User: Lists the user in your organization that triggered the alert.
Created Time: Displays the time the incident was created.
You can filter the Incidents list by Acknowledged or Unacknowledged incidents. The default view is Unacknowledged incidents. Click  to customize the view by the following options:
Severity: Select incidents to view by a specific severity level.
Acting User: Search for a specific user.
Application: Select an application name.
Instance: Search for an instance.
Behavior Analytics Policy: Select a policy you created in Policies > Behavior Analytics.
Use the Sort by option to view the Incidents table data by:
Created Time (default)
Application
Severity
Behavior Analytics Policy
Created Time
Last Edited Time
Click the gear  icon to customize the columns.
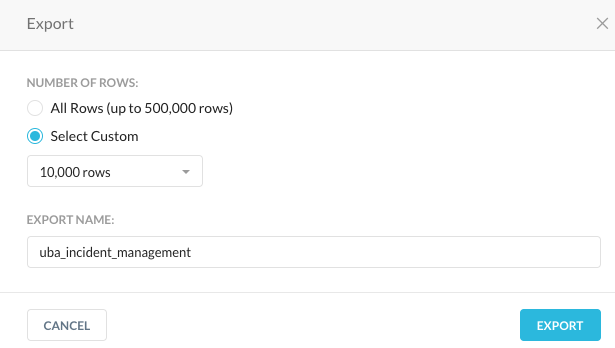
You can export all rows (up to 500,000) or select a custom number or rows (1,000 rows, 10,000 rows, or 100,000 rows). Type a name for your export file and click Export.
