Network Steering
The Network Steering page provides information about all the Internet Protocol Security (IPSec) and Generic Routing Encapsulation (GRE) tunnels in your infrastructure. This includes the following information:
Currently connected POP per tunnel: See where traffic is flowing.
Tunnel status: See whether the tunnel is up or down.
Tunnel Throughput: The volume of traffic that is going through each tunnel.
Tunnel Configured State: If the tunnel is configured in the Netskope UI.
Tunnel Flow Count: The number of flows that are being seen per tunnel.
Tunnel Endpoint Count: The number of endpoints that are seen per tunnel.
Netskope Service Status: The current state of the Netskope Service.
These tunnels steer HTTP and HTTPS traffic from SaaS apps to the Netskope cloud. To learn more about IPSec and GRE, see IPSec and GRE.
Global Tunnel Map
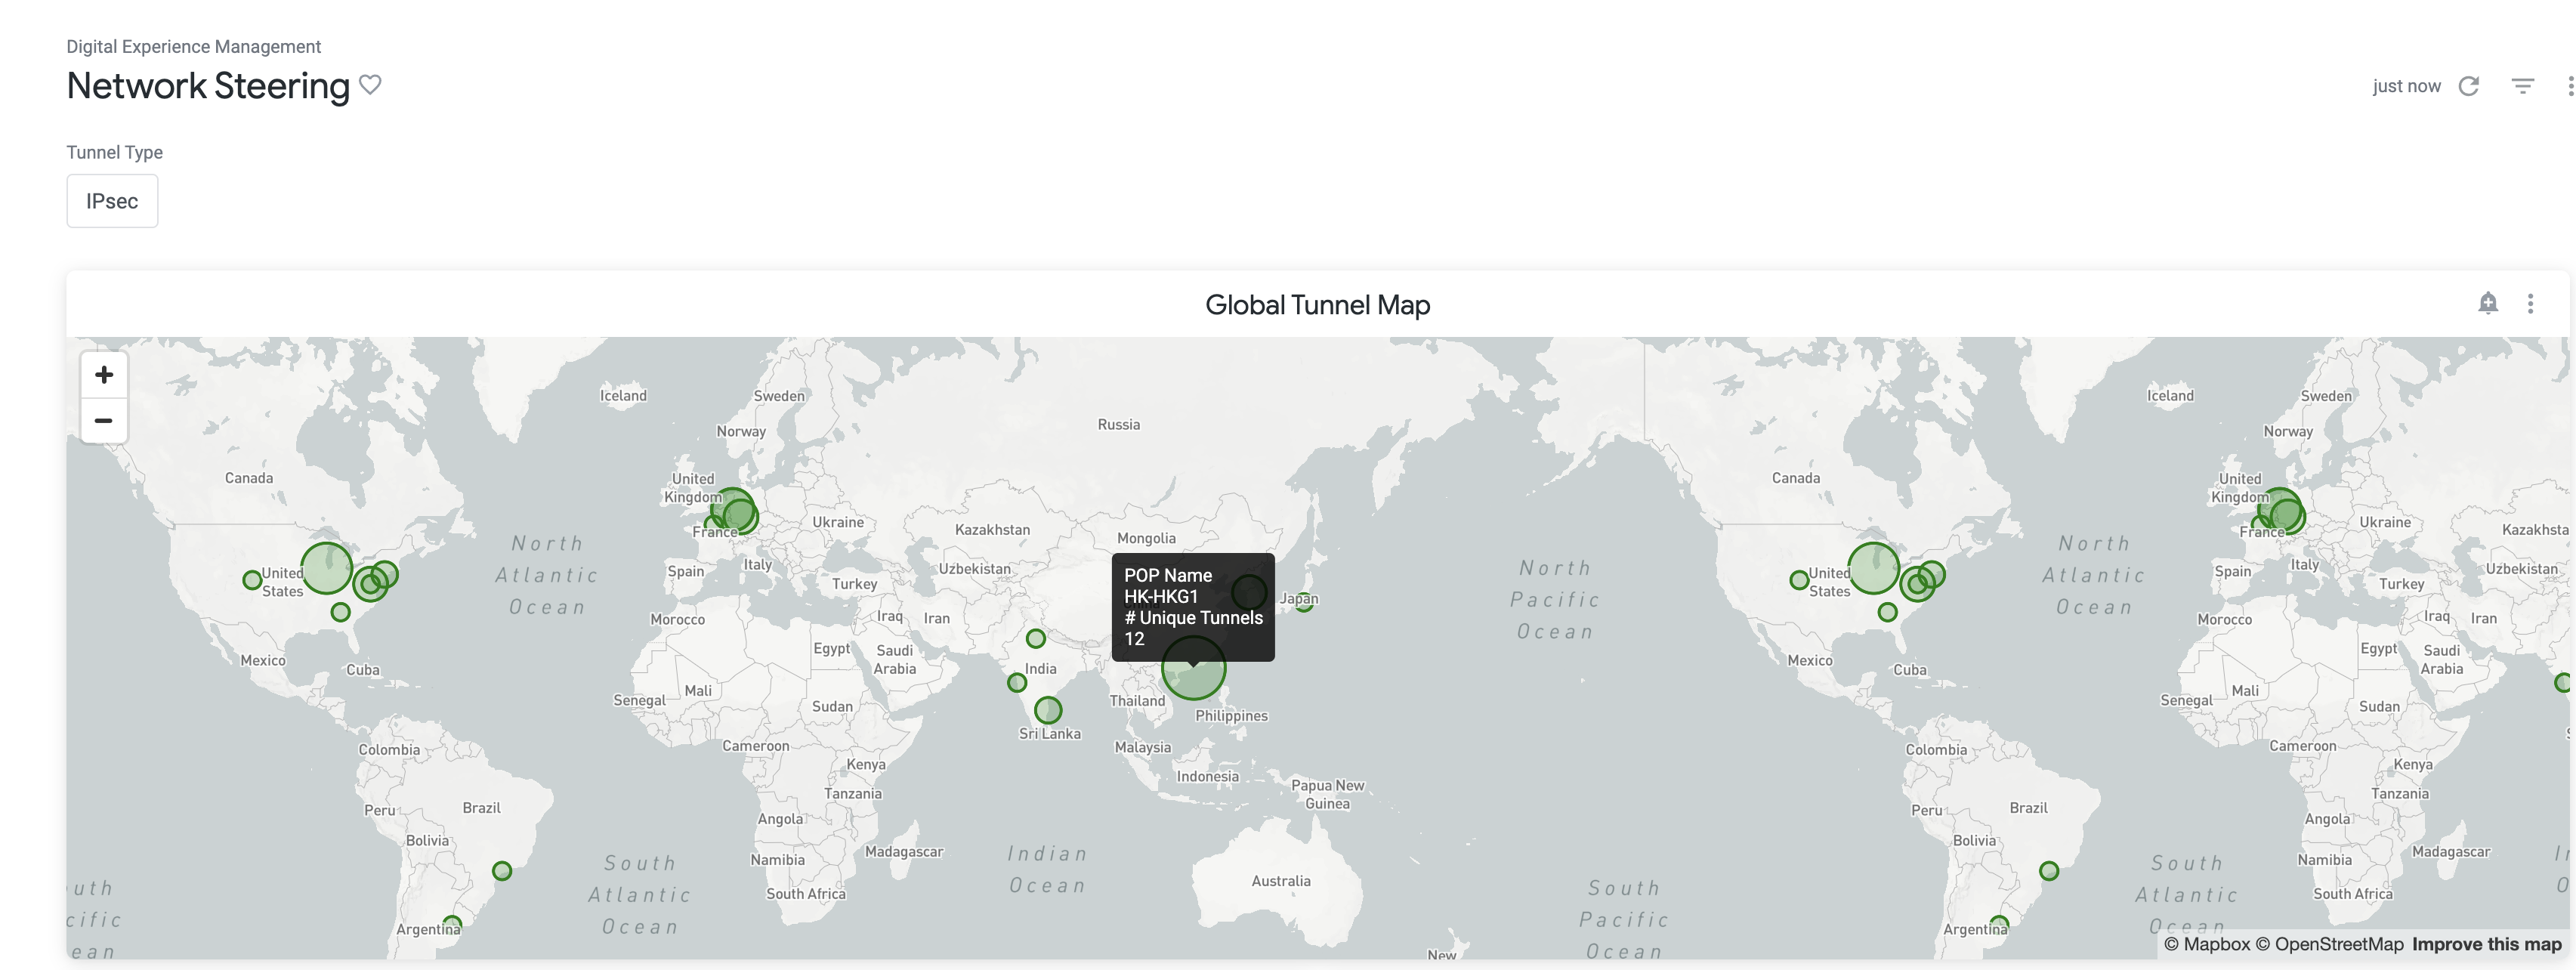
The Global Tunnel Map displays all the IPSec and GRE tunnels in your network. Using the map, you can immediately see the number of tunnels in any geographic region. Each green circle indicates the Netskope POP to which the tenant sends IPSec or GRE traffic. Larger circles indicate a greater number of unique tunnels sending traffic to the specific POP. When you mouse over the green circles, you can see the name of the POP to which the tunnel is sending traffic, and the number of unique tunnels.

IPSec Tunnel Details
The IPSec Tunnel Details widget displays the near real-time status and throughput of all IPSec tunnels configured to send traffic for the tenant. The widget displays the timestamp for when the UP or DOWN tunnel event was observed.

Source Identity: The IKE identifier on the router that originates the tunnel. For example, 1.1.1.1., sourcelocation.company.com, or sourcelocation@company.com.
Source IP: The public source IP Address of the IPSec Tunnel, indicating the source seen by the Netskope Service.
POP Name: The Point of Presence (POP) where the tunnel terminates.
Tunnel Status: The status of the tunnel.
Throughput: The volume of traffic observed through the IPSec tunnel per second which is computed by analyzing the traffic flowing in a tunnel on a per minute basis.
Configured State: The status of the tunnel that indicates whether it is Enabled or Disabled in the Netskope UI.
Event Timestamp: The time of the last tunnel status change.
Timestamp For Last Seen Flow Count: The time when the last active flow count (in the “Flow Count Last Seen” column) was seen.
Flow Count Last Seen: The number of active flows seen for each IPSec Tunnel on a per minute basis.
Netskope Service Status:The status of the Netskope Service at the POP where the tunnel is terminated.
IPSec Tunnel Status
The IPSec Tunnel Status widget displays the historical status of all IPSec tunnels configured to send traffic for the tenant. The tunnel status display will show any changes in the status of a tunnel over a period of time. The status changes based on the tunnel being up or down.

IPSec Tunnel Active Flow Count
The IPSec Tunnel Active Flow Count widget displays the number of active flows seen in a tunnel every minute. This active flow count is displayed as a time series view to show the change in activity in a tunnel over a period of time. By default, it will show the Flow Count for all tunnels unless filtered above in the “IPSec Tunnel Name” Drop down.

IPSec Tunnel Active Endpoint Count
The IPSec Tunnel Active Endpoint Count widget displays the number of unique devices that connect over a tunnel every minute.

IPSec Tunnel Throughput Widget
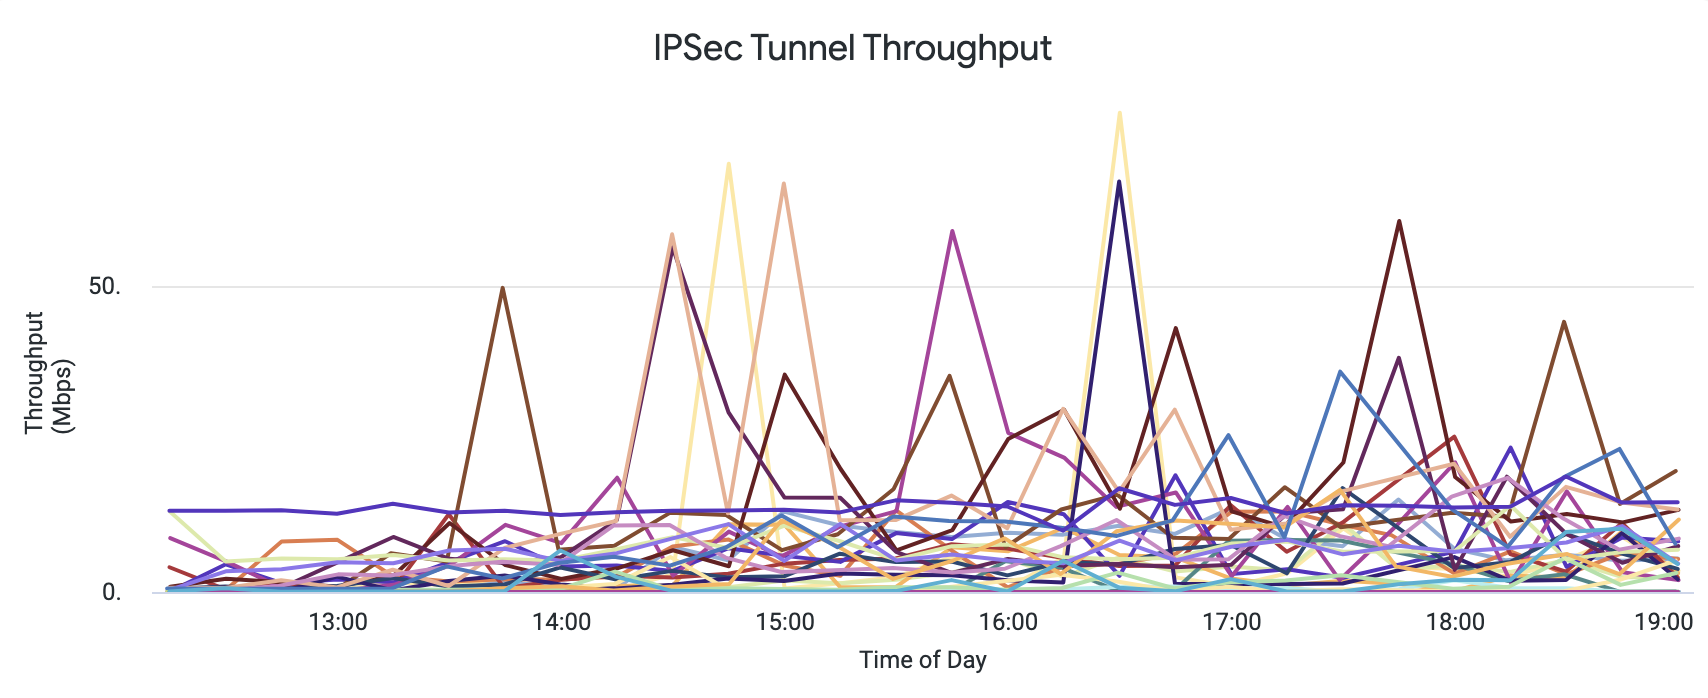
The IPSEC Tunnel Throughput Widget displays the throughput of every configured IPSec tunnel where traffic is seen. The IPSec Tunnel Throughput is displayed as a time series view to show the change in throughput in an IPSec tunnel over a period of time. This throughput is displayed in Megabits per second (Mbps). By default, it will show the throughput for all IPSec tunnels unless filtered in the “IPSec Tunnel Name” dropdown.

GRE Tunnel Details
The GRE Tunnel Details widget displays the near real-time status and throughput of all GRE tunnels configured to send traffic for the tenant. The widget displays the timestamp for when the UP or DOWN tunnel event was observed. The tunnel status is shown as UNKNOWN when no traffic is detected through the tunnel. The widget also displays the status and timestamp for when the last keep alive event was observed.

Tunnel Name: The name of the tunnel.
Source IP: The source IP Address of the GRE Tunnel.
POP Name: The Point of Presence (POP) where the tunnel terminates.
Tunnel Status: The status of the tunnel.
Throughput: The volume of traffic observed through the GRE tunnel per second which is computed by analyzing the traffic flowing in a tunnel on a per minute basis.
Configured State: The status of the tunnel that indicates whether it is Enabled or Disabled in the Netskope UI.
Event Timestamp: The time of the last GRE tunnel status change.
KeepAlive Status: Indicates whether the Netskope Service has received a keepalive from the respective tunnel.
KeepAlive Last Seen Time: The most recent time the Netskope Service has seen a keepalive from the GRE tunnel.
Timestamp for Last Seen Flow Count: The time when the last active flow count (in the “Flow Count Last Seen” column) was seen.
Last Seen Flow Count:The number of active flows seen for each GRE Tunnel on a per minute basis.
Netskope Service Status:The status of the Netskope Service at the POP where the GRE tunnel is terminated.
GRE Tunnel Status
The GRE Tunnel Status widget displays the historical status of all GRE tunnels configured to send traffic for the tenant. The tunnel status display will show any changes in the status of a tunnel over a period of time. The status changes based on the tunnel being up or down.

GRE Tunnel Active Flow Count
The GRE Tunnel Active Flow Count widget displays the number of active flows seen in a GRE tunnel every minute. This active flow count is displayed as a time series view to show the change in activity in a GRE tunnel over a period of time. By default, it will show the Flow Count for all GRE tunnels unless filtered in the “GRE Tunnel Name” dropdown.

GRE Tunnel Active Endpoint Count
The GRE Tunnel Active Endpoint Count widget displays the number of unique devices that connect over a GRE tunnel every minute. This active endpoint count is displayed as a time series view to show the change in activity in a GRE tunnel over a period of time. By default, it will show the Endpoint Count for all GRE tunnels unless filtered above in the “GRE Tunnel Name” dropdown.

GRE Tunnel Throughput Widget
The Tunnel Throughput Widget displays the throughput of every configured GRE tunnel where traffic is seen. The GRE Tunnel Throughput is displayed as a time series view to show the change in throughput in a GRE tunnel over a period of time. This throughput is displayed in Megabits per second (Mbps). By default, it will show the throughput for all GRE tunnels unless filtered above in the “GRE Tunnel Name” dropdown.
