OT Device Discovery
Navigate to the Inventory menu > Activities tab to see the discovered OT devices in the environment. The page lists the devices discovered in the OT network like Scada Master, Slave and Outstation, etc.
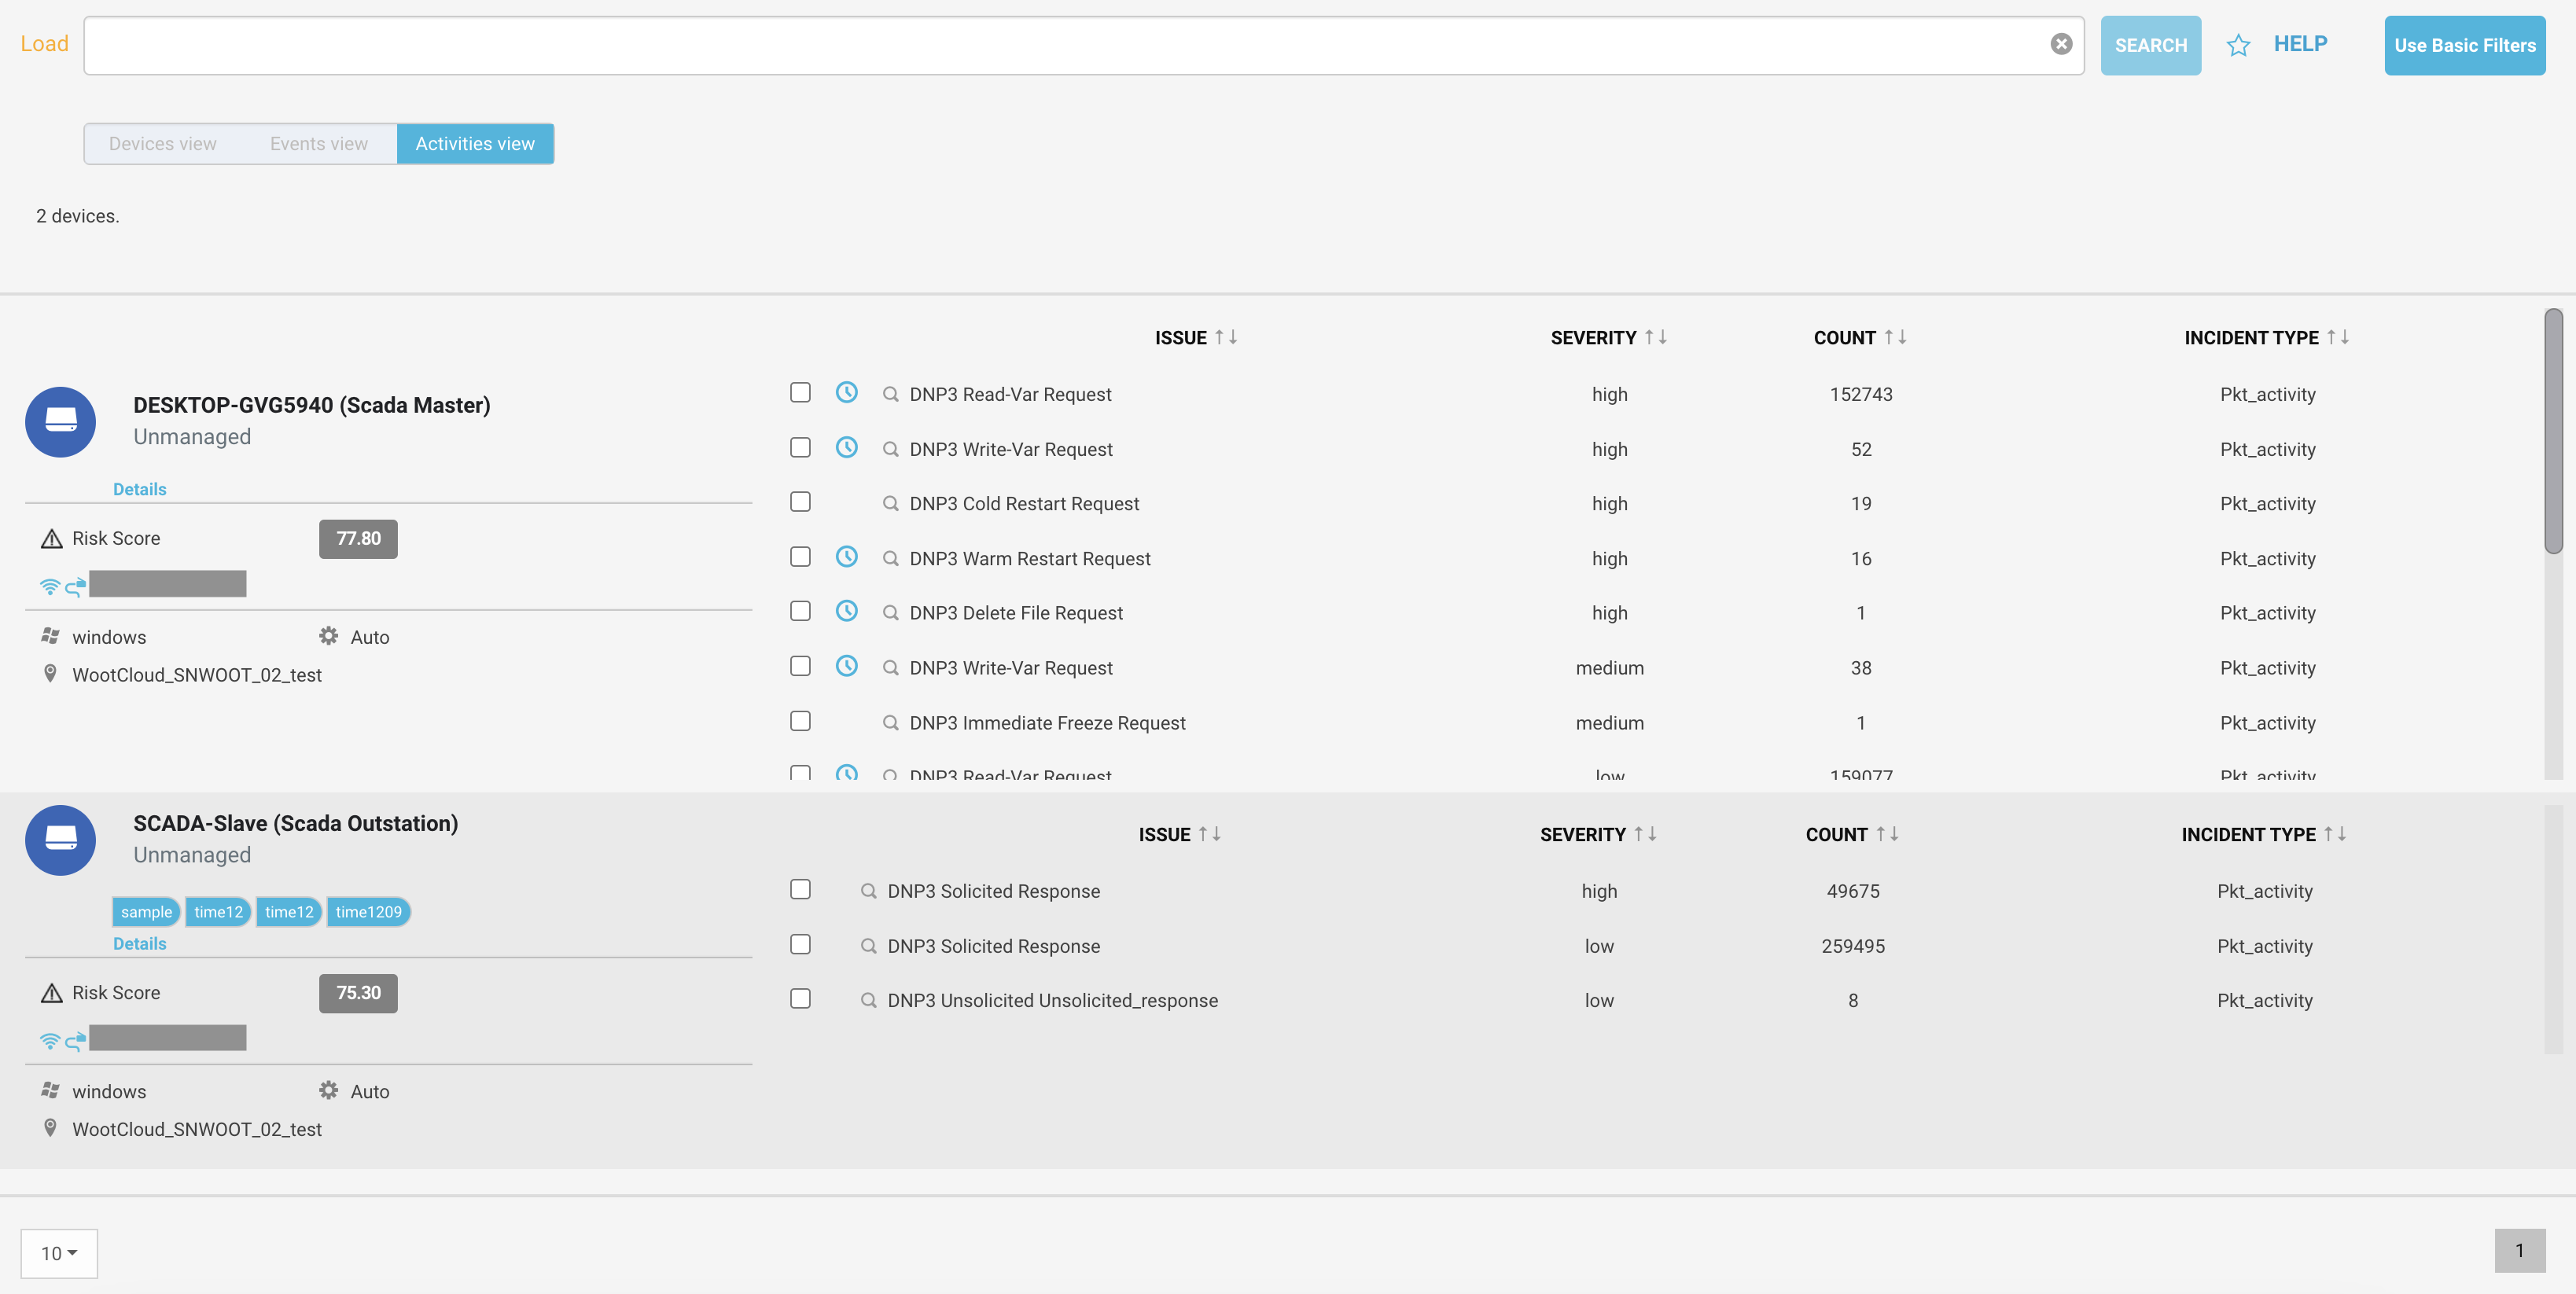 |
The screen shows the host's name, type, tags assigned, and managed or unmanaged information.
Click the details link to see the device summary.
You can see the risk score calculated by Netskope proprietary risk engine, which categorizes packet alerts, device software vulnerabilities and device behavior anomalies into threat vectors.
It specifies the spectrum of the device.
You can see the operating system and site assigned information. It shows if the device is user or automatically controlled.
Important
You can filter the OT devices using
type = "scada master"andtype = "scada outstation".You can look up for
Category = “industrial_automation”in the search filter for a list of OT Devices.You can look for devices based on Vertical for example, `vertical = "enterprise"` or `vertical = "industrial"` or `vertical = "medical"`.
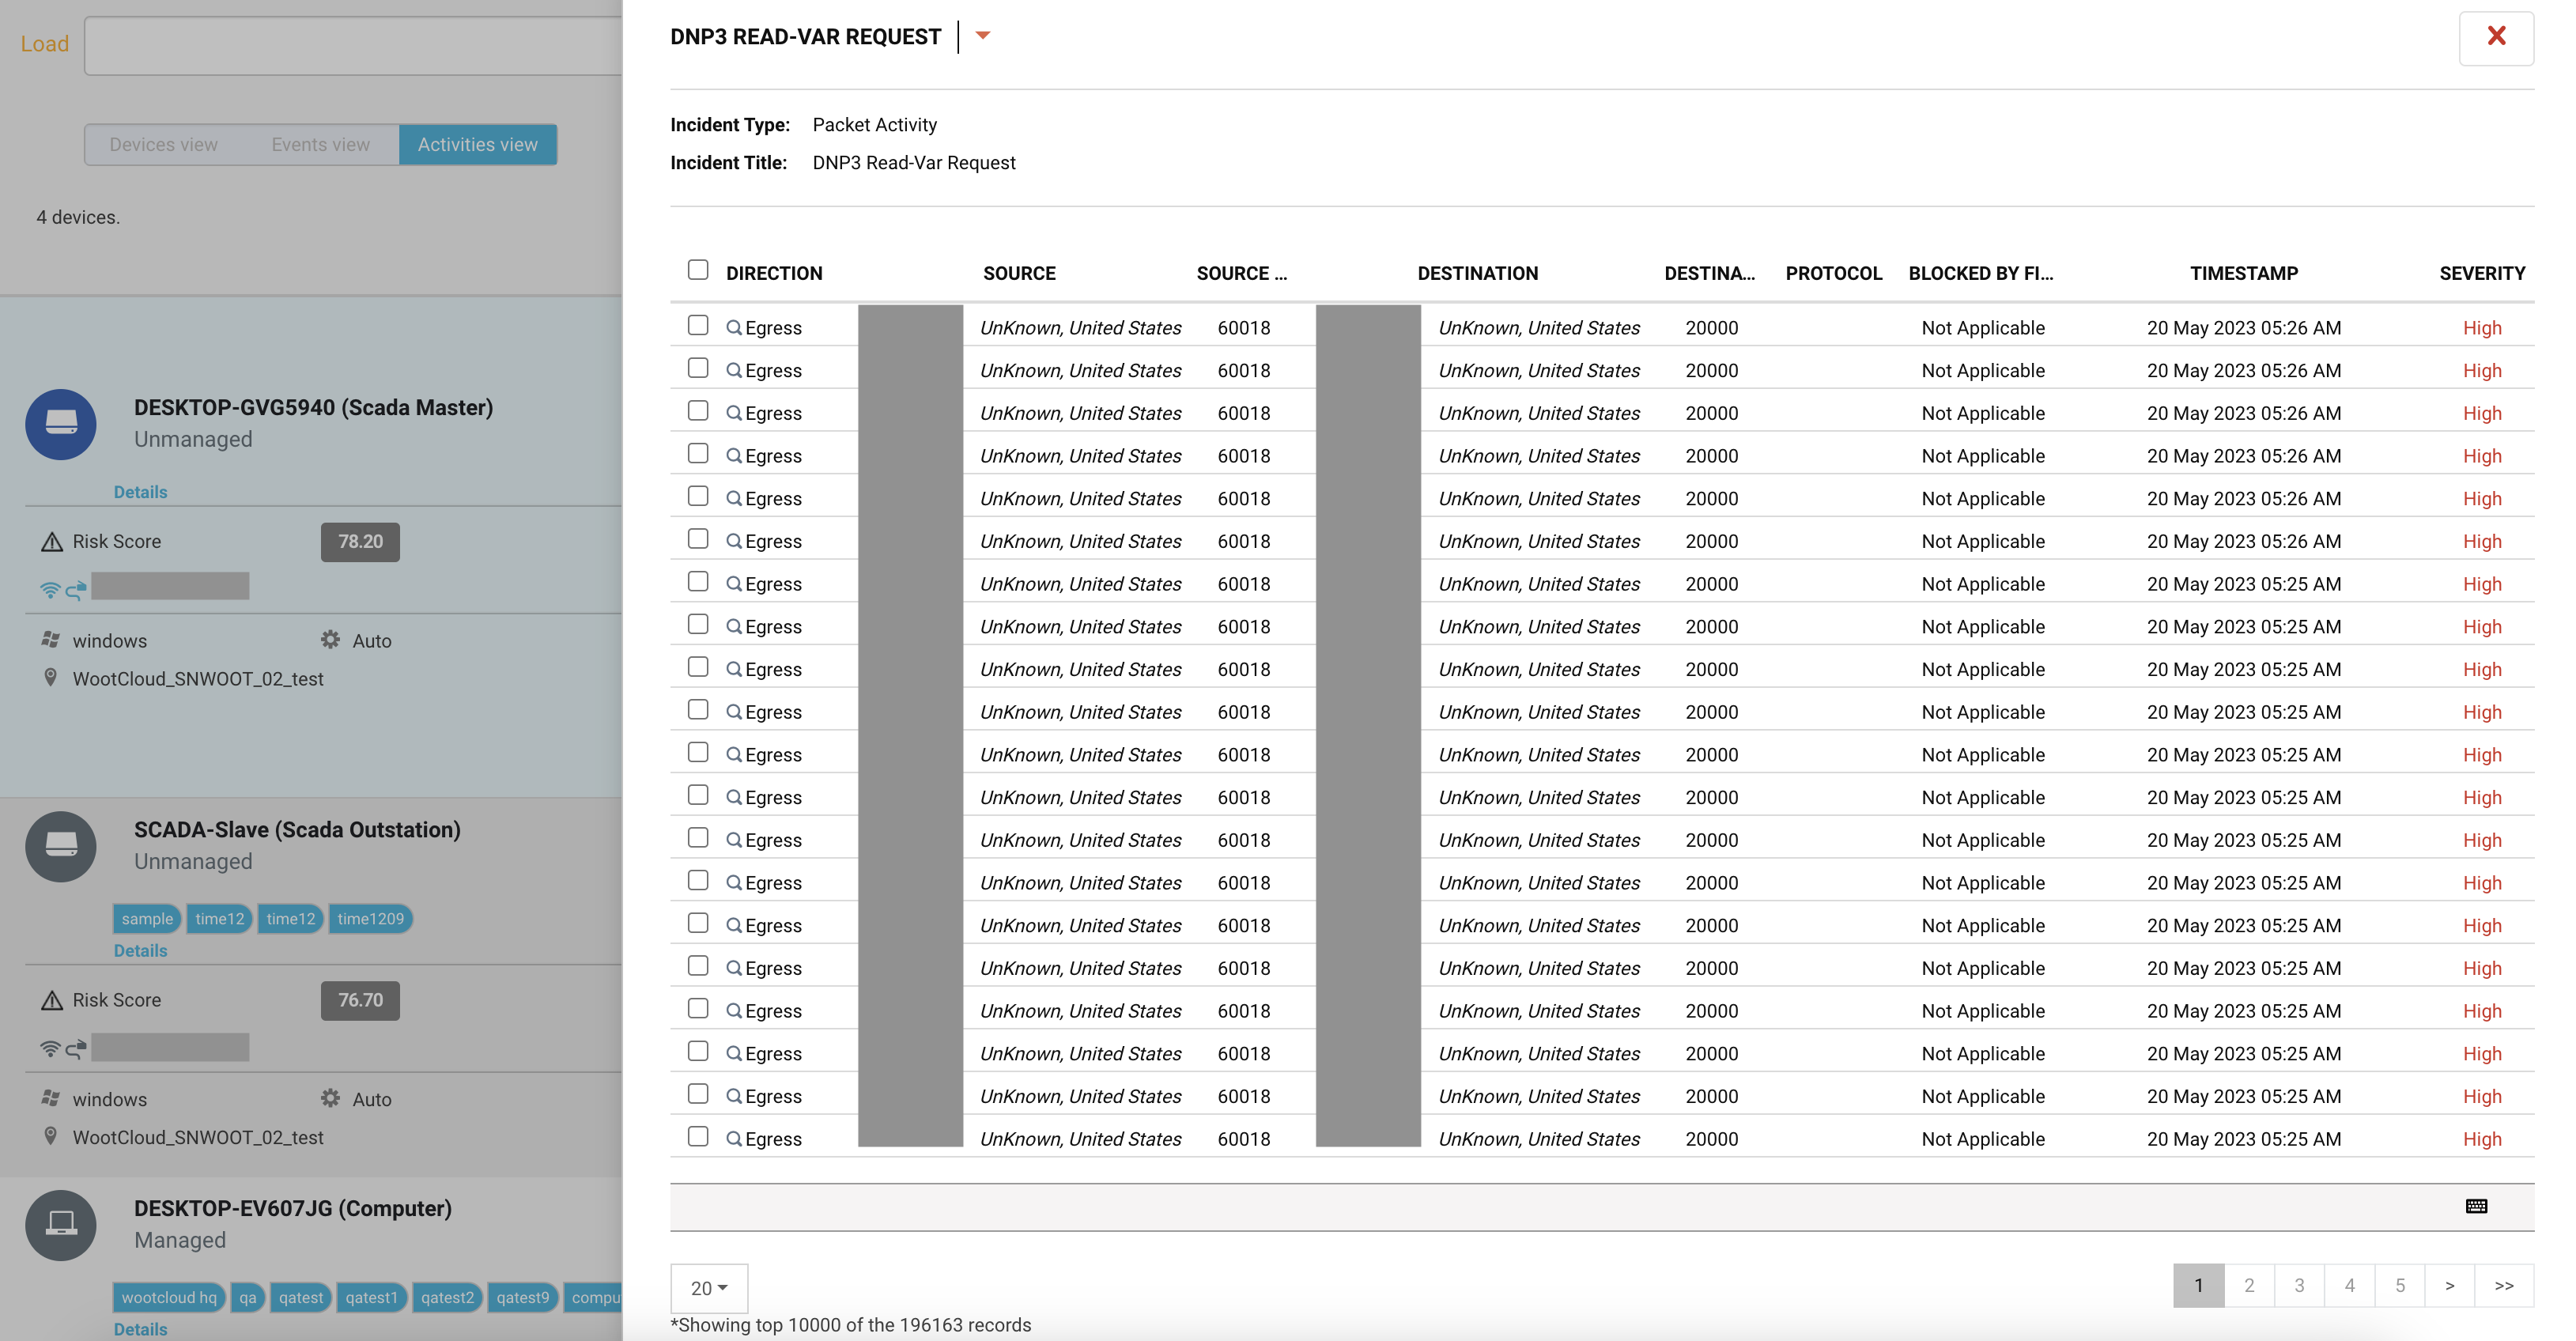
Find the issue list of every device in front of the device's name. Click on a specific issue for more information on the issue. You can see the source, source port and destination and destination port of the specific issue with the timestamp.
 |
Navigate to the Inventory menu > Activities view and click on the details link of any device. You will see detailed information about the device and the risks.
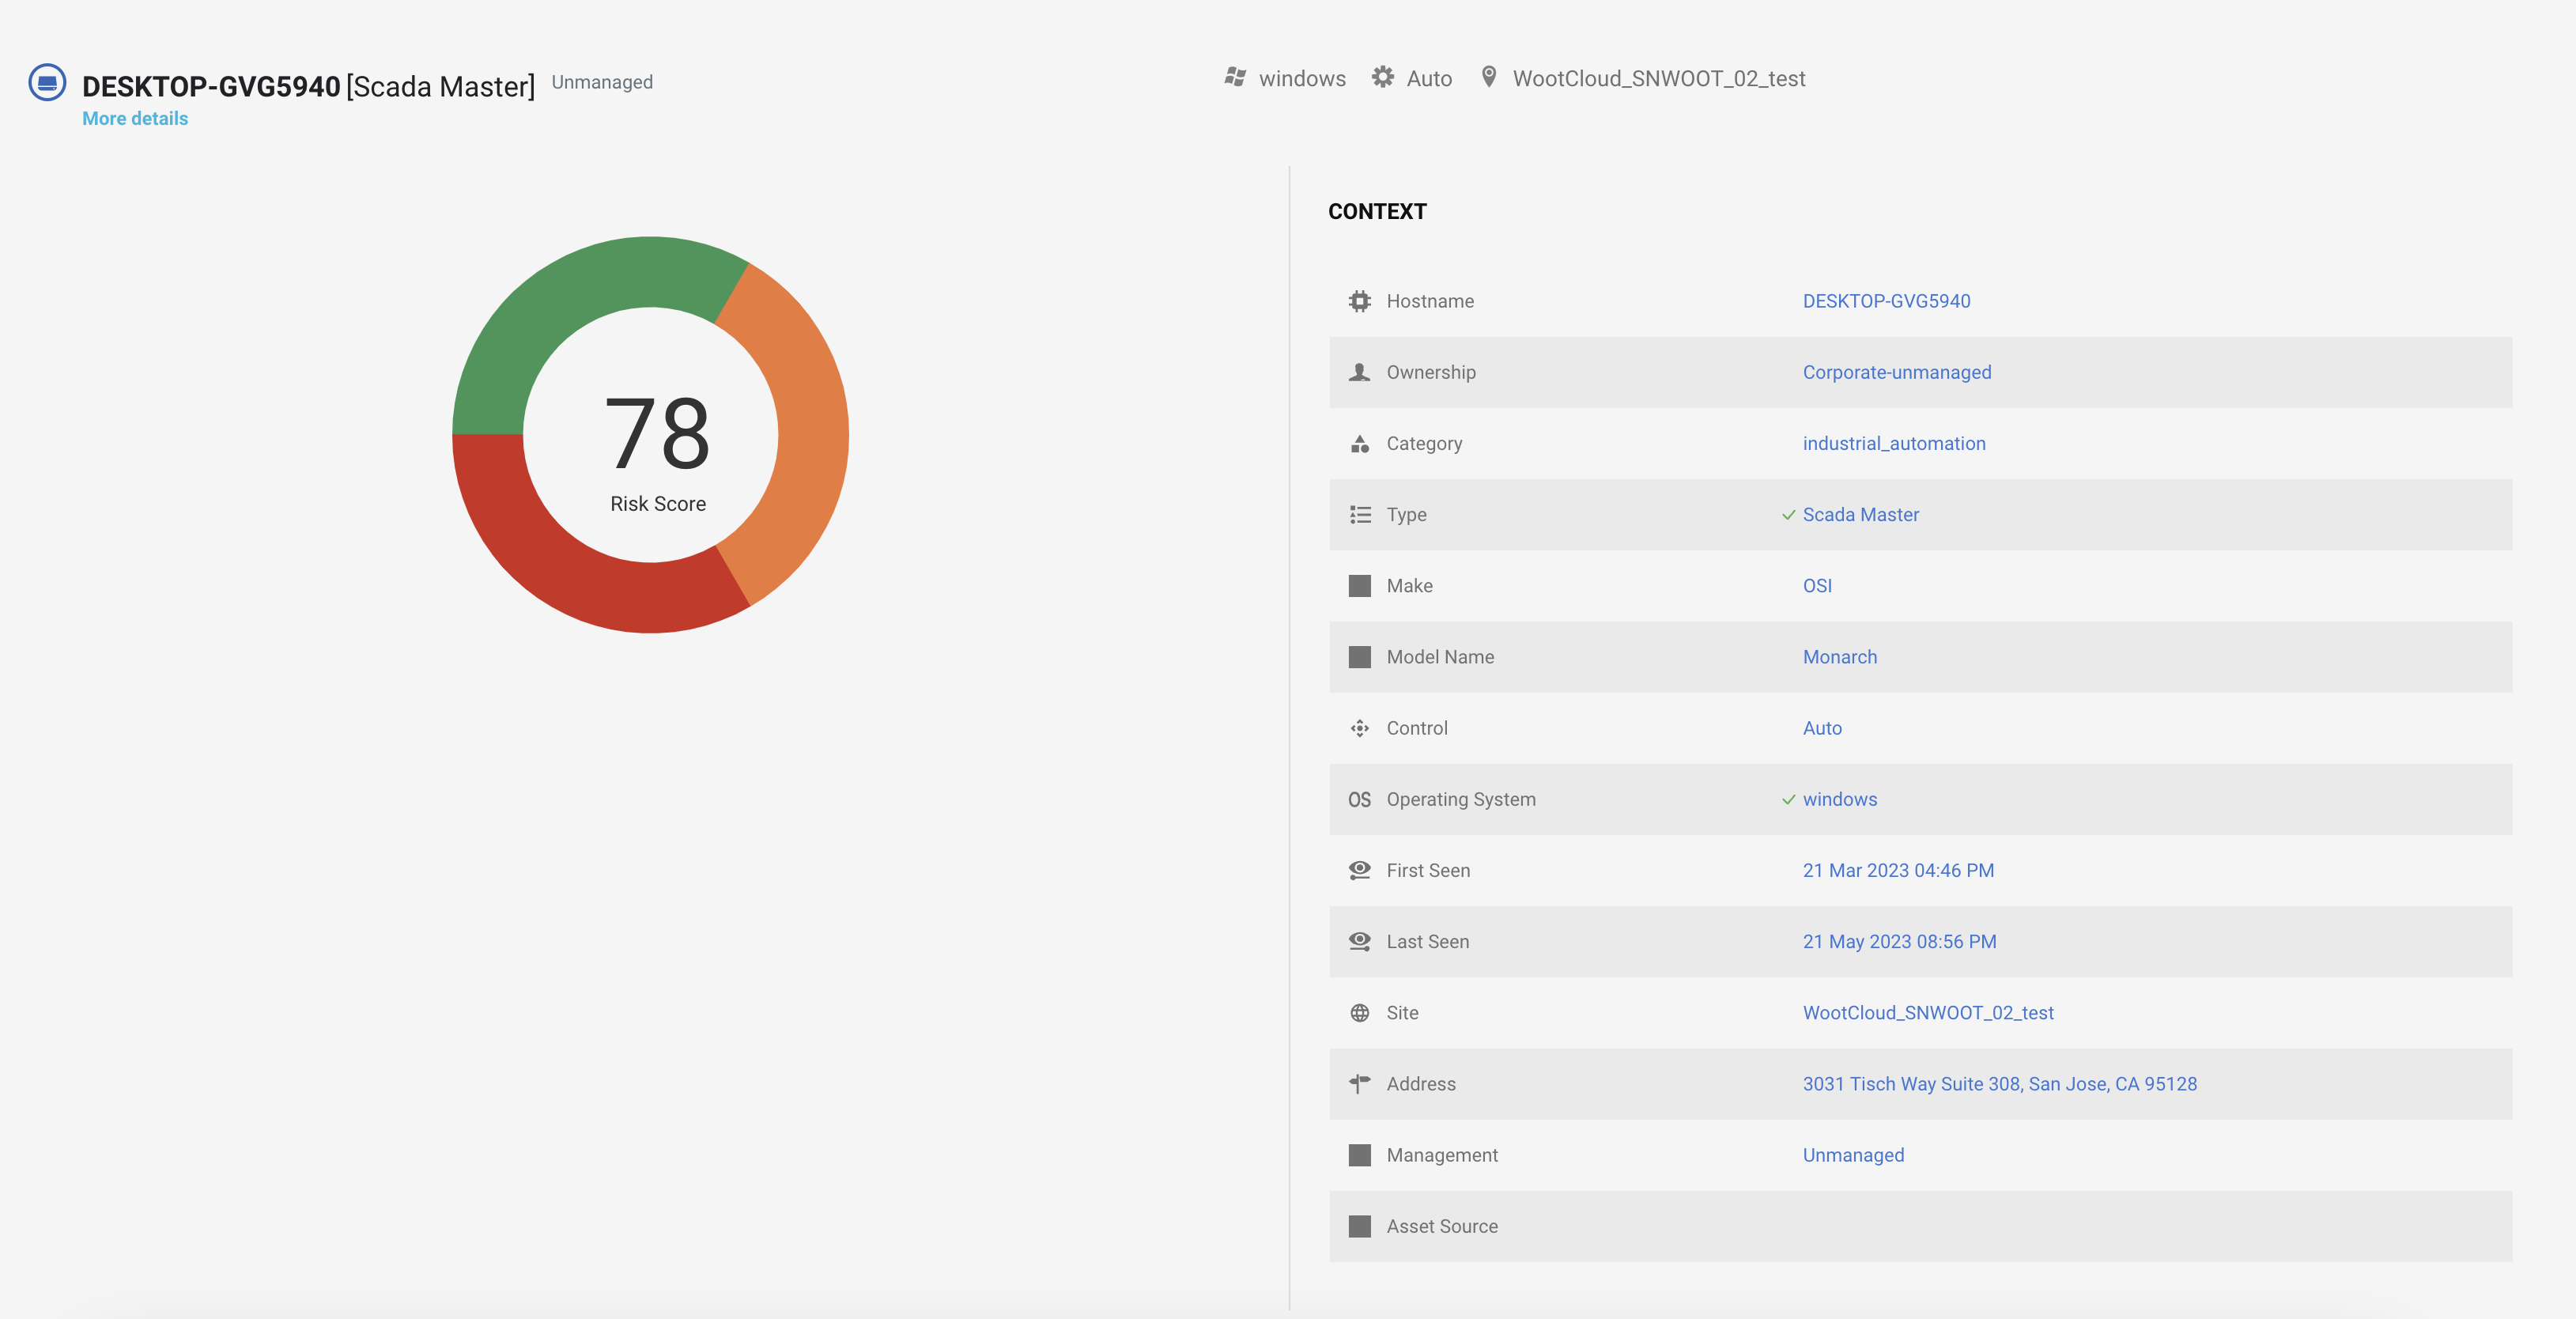 |
The screen shows a pie chart risk score and distinct risk contributions to the score of the device. You can see the drill down details of the device on the left side with hostname, ownership, category, type, make, model name, etc of the device.
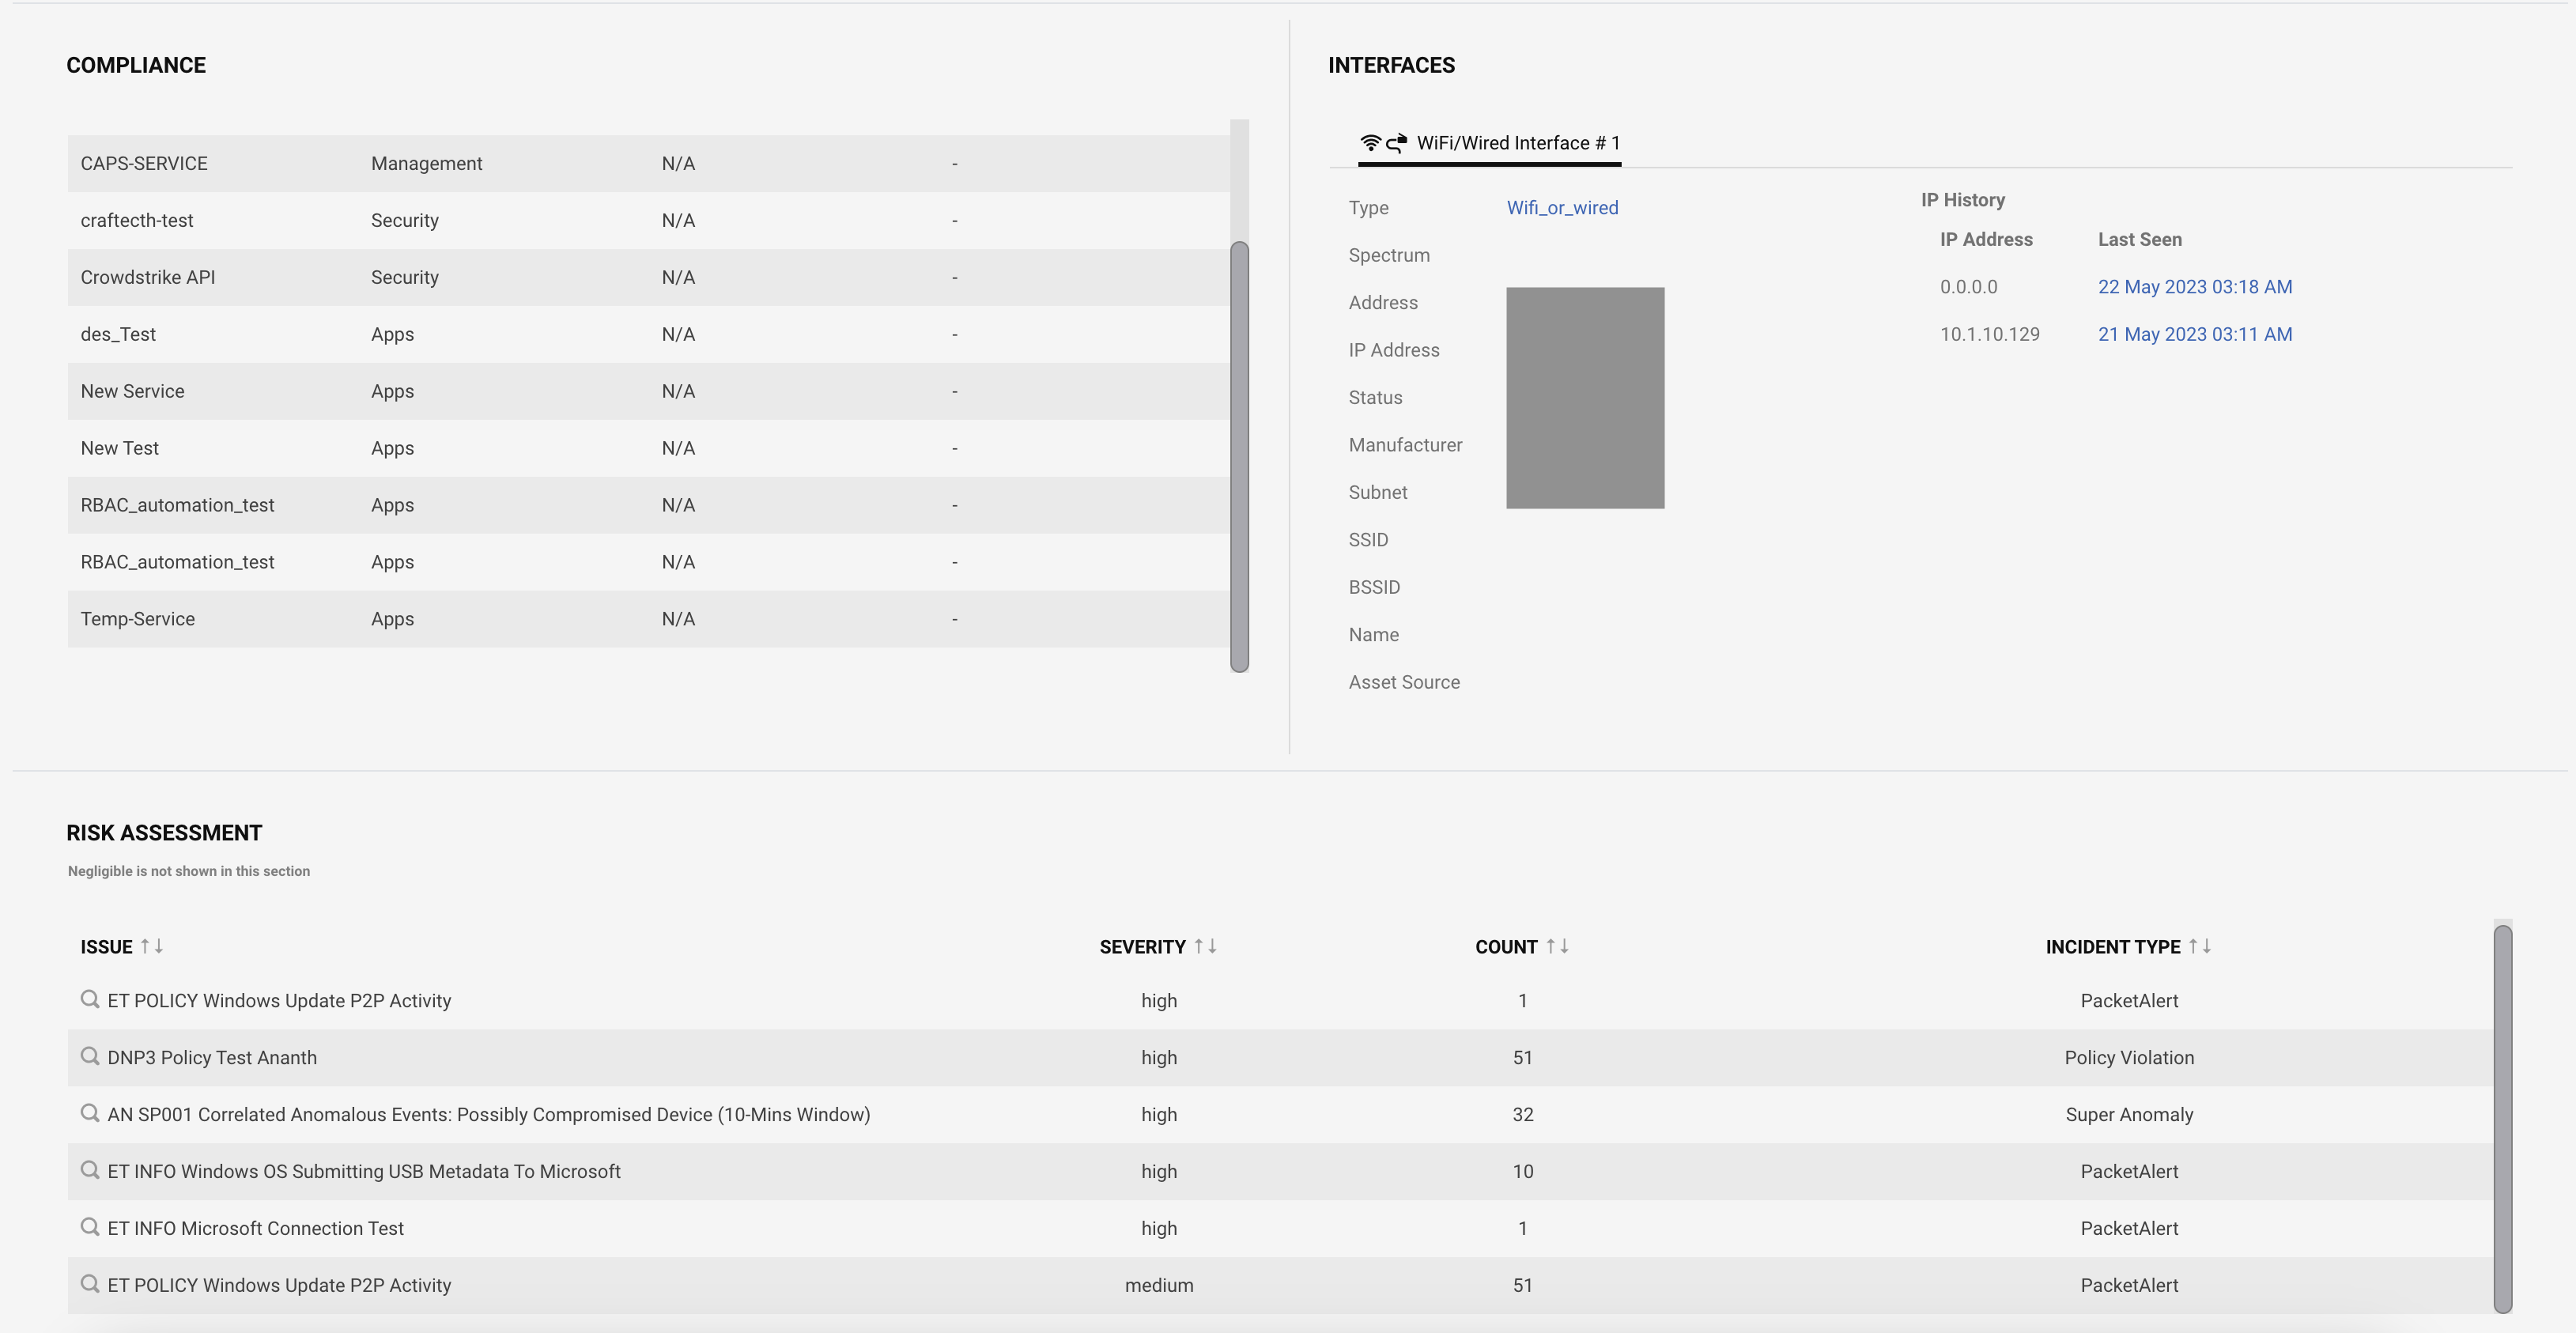 |
On the device details page, you can see the device compliance with the asset management systems services. You can also see the interface connection on the left side. Risk assessment shows the list of risk issues on the device with severity and number of occurrences.
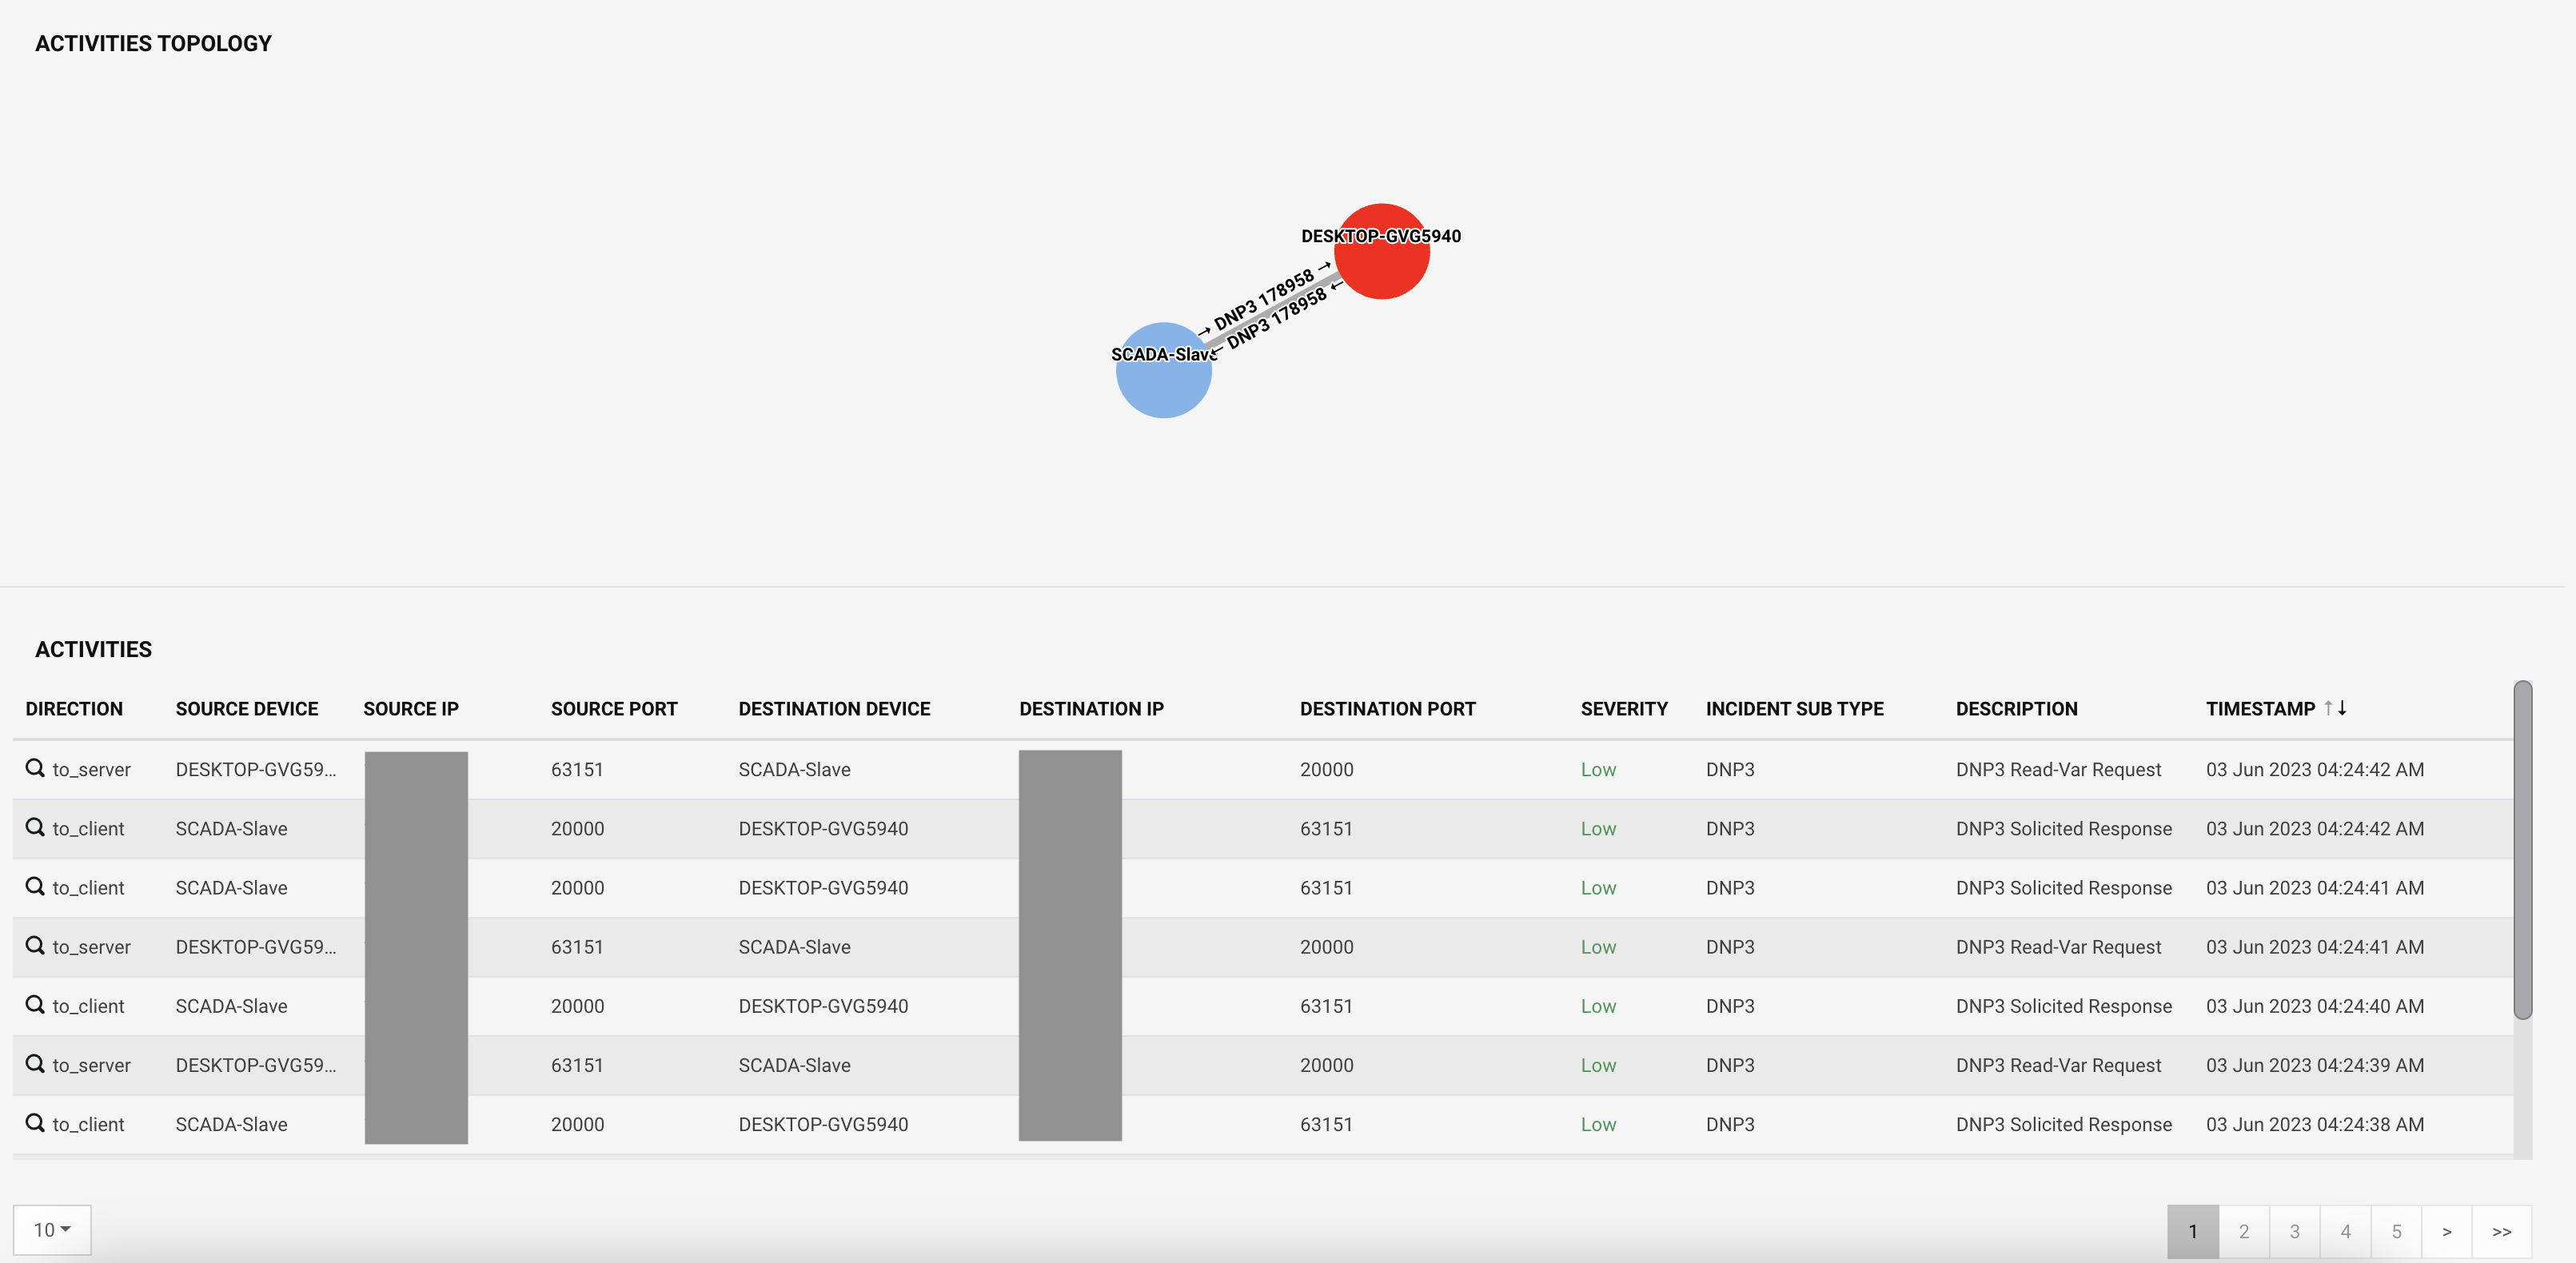 |
You can see the activities table showing a list of OT activities from/to the device in a chronological order. The table shows source and destination of each activity including the IP address, port, activity description, activity protocol, timestamp.
Click on the direction to see details of the single activity. It also includes the protocol payload in json format.
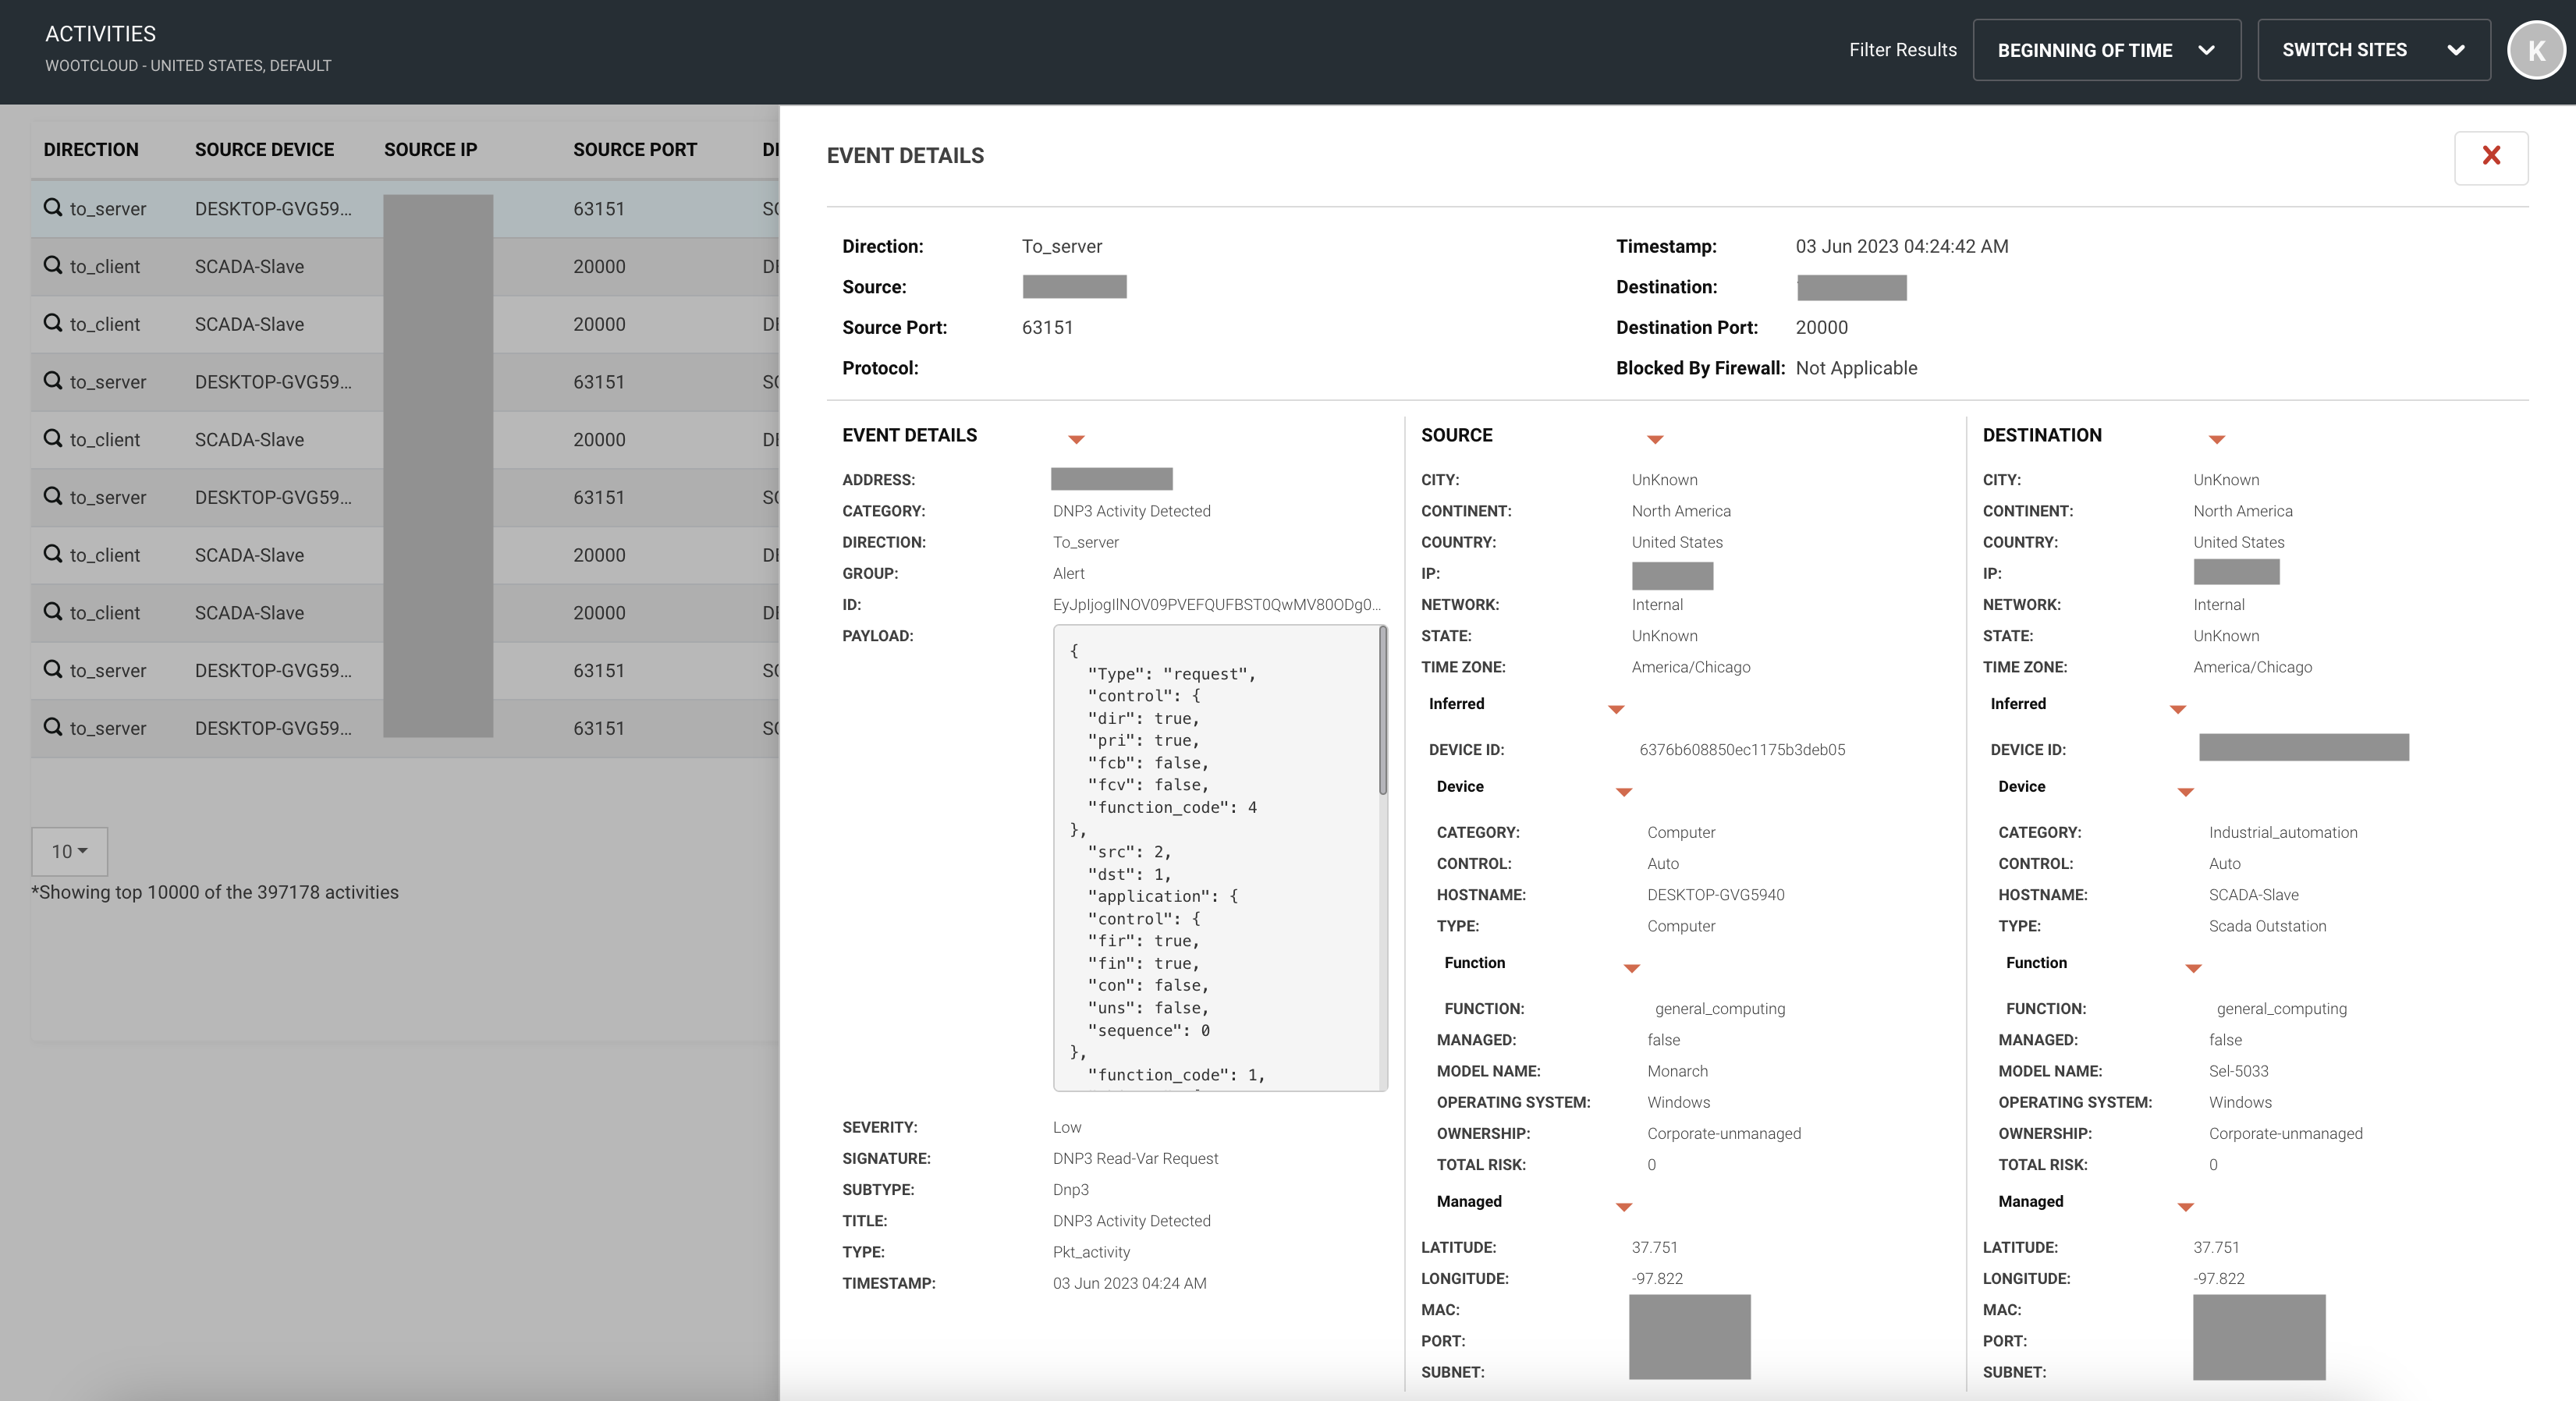 |
OT Device Verticals
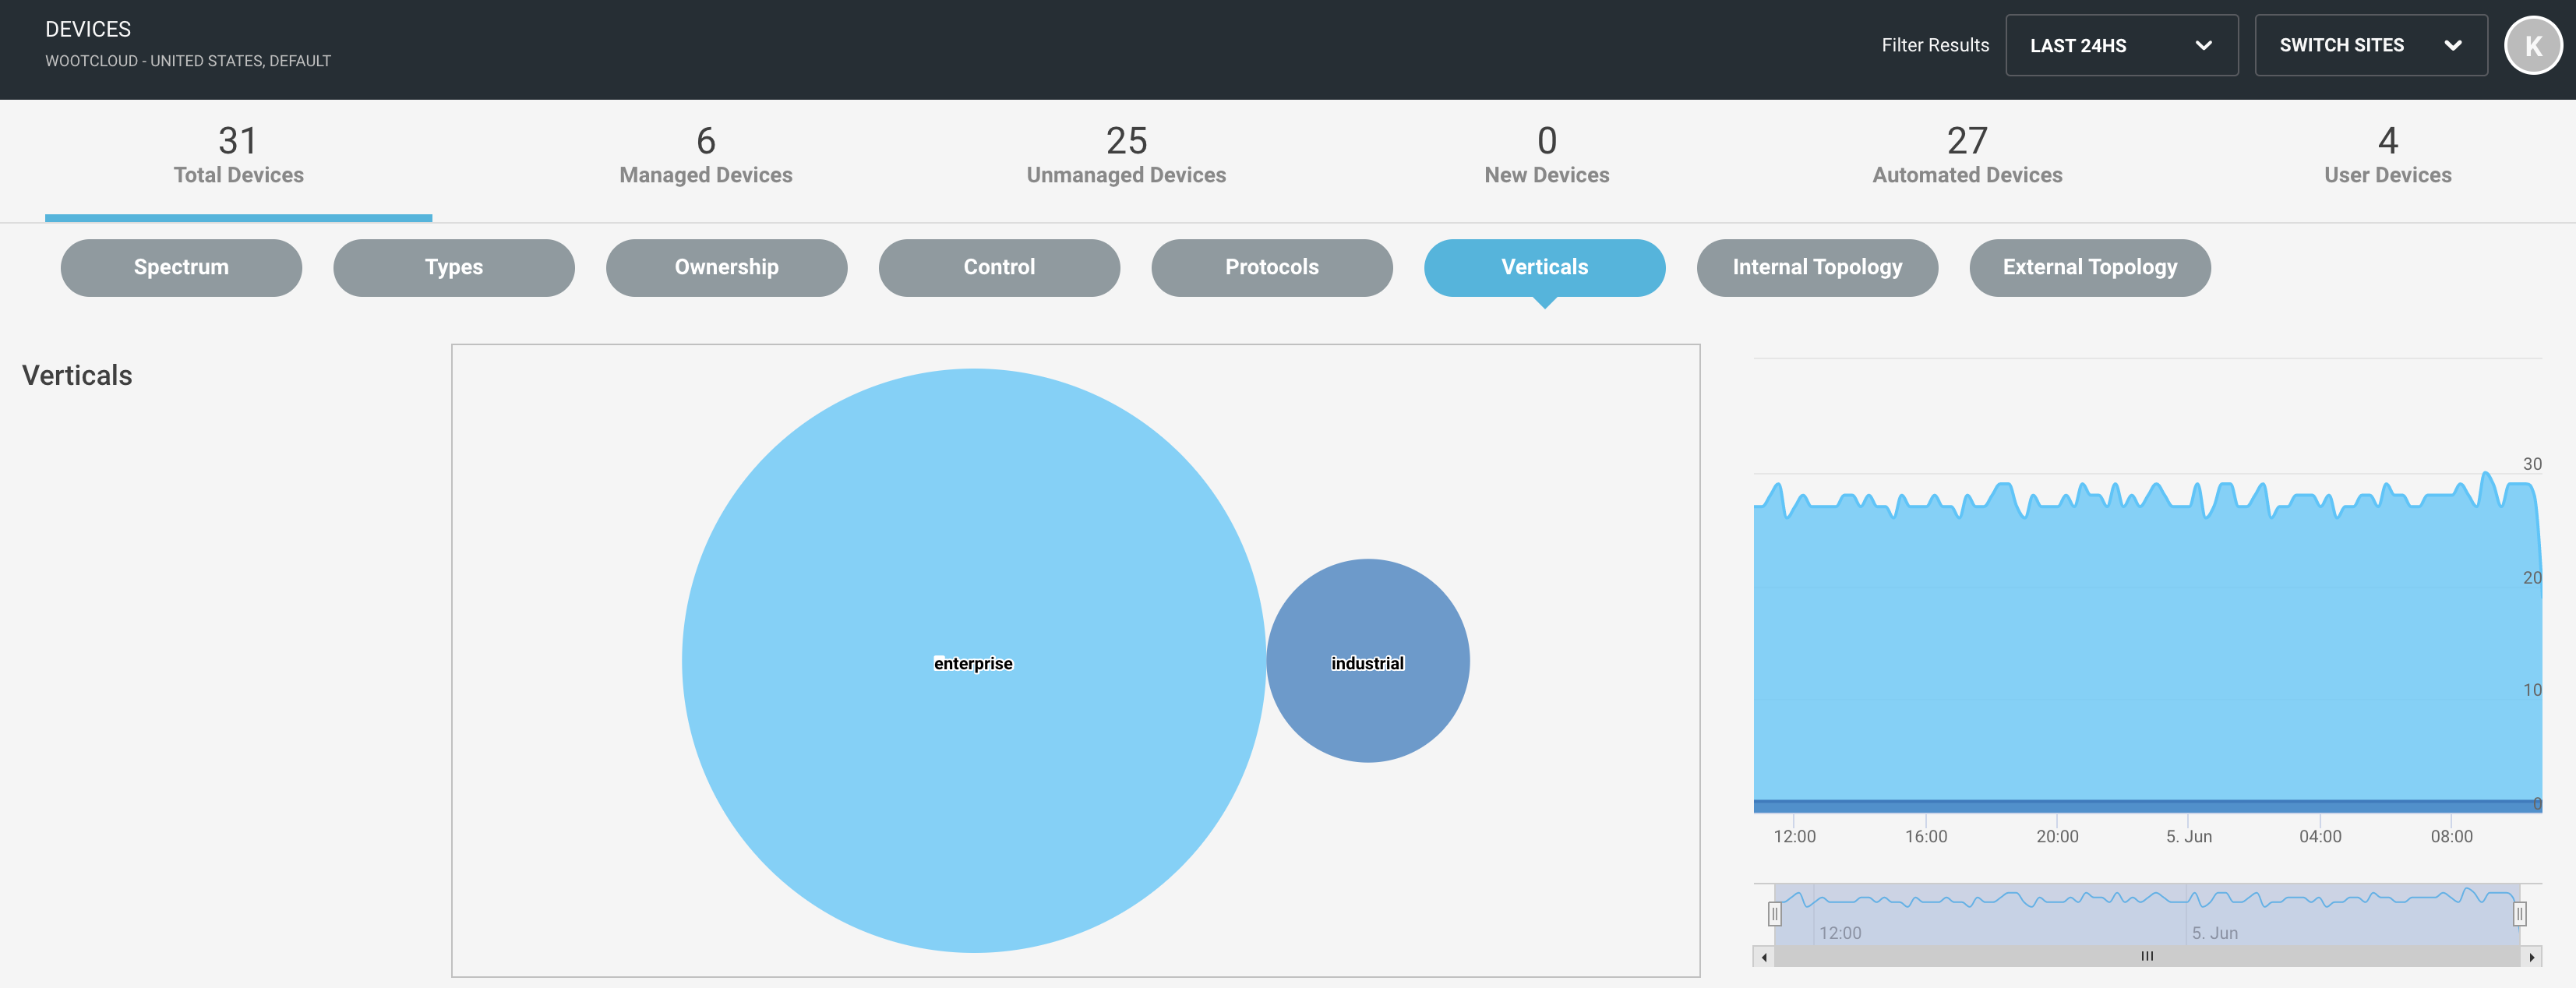
Navigate to the Investigate > Devices menu, Vertical tab shows the OT devices segregated in the Industrial, Medical and Enterprise vertical.
 |
Note
You can also sort the device summary in combination with the total of all devices, managed, unmanaged, new, automated, and user-controlled devices
You will see a pie chart with the number of devices in different verticals. Clicking on any of the vertical charts will redirect you to the Inventory menu with the filter for that vertical. The high chart on the right shows the analog representation of the OT devices in different verticals on a specific time stamp.