Cloud Firewall Advanced Analytics Events
Cloud Firewall Events log all traffic that is steered to Netskope through Cloud Firewall.
Notice
Your account must be enabled for Cloud Firewall and an additional license is required to use Cloud Firewall Events.
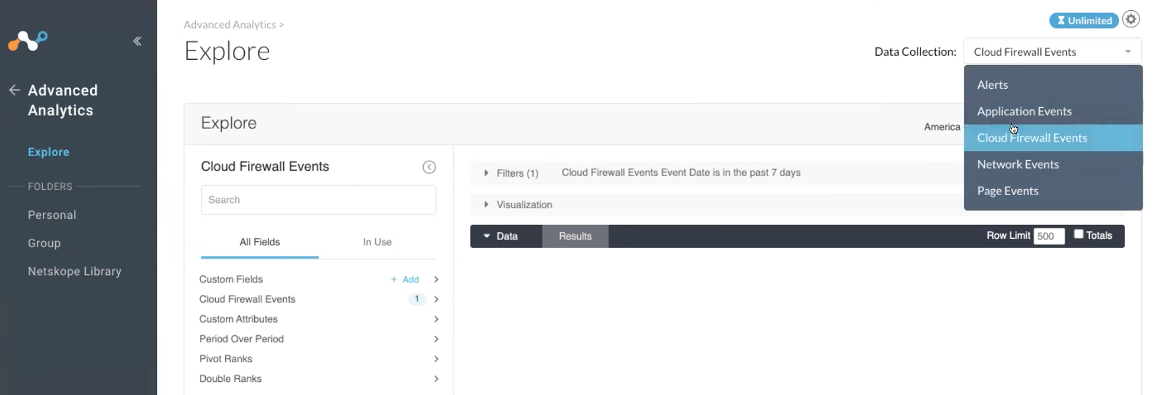
To view Cloud Firewall Events, go to Advanced Analytics > Explore > Data Collection > Cloud Firewall Events.

To learn more about the dimensions and fields: Exploring Data in Reports
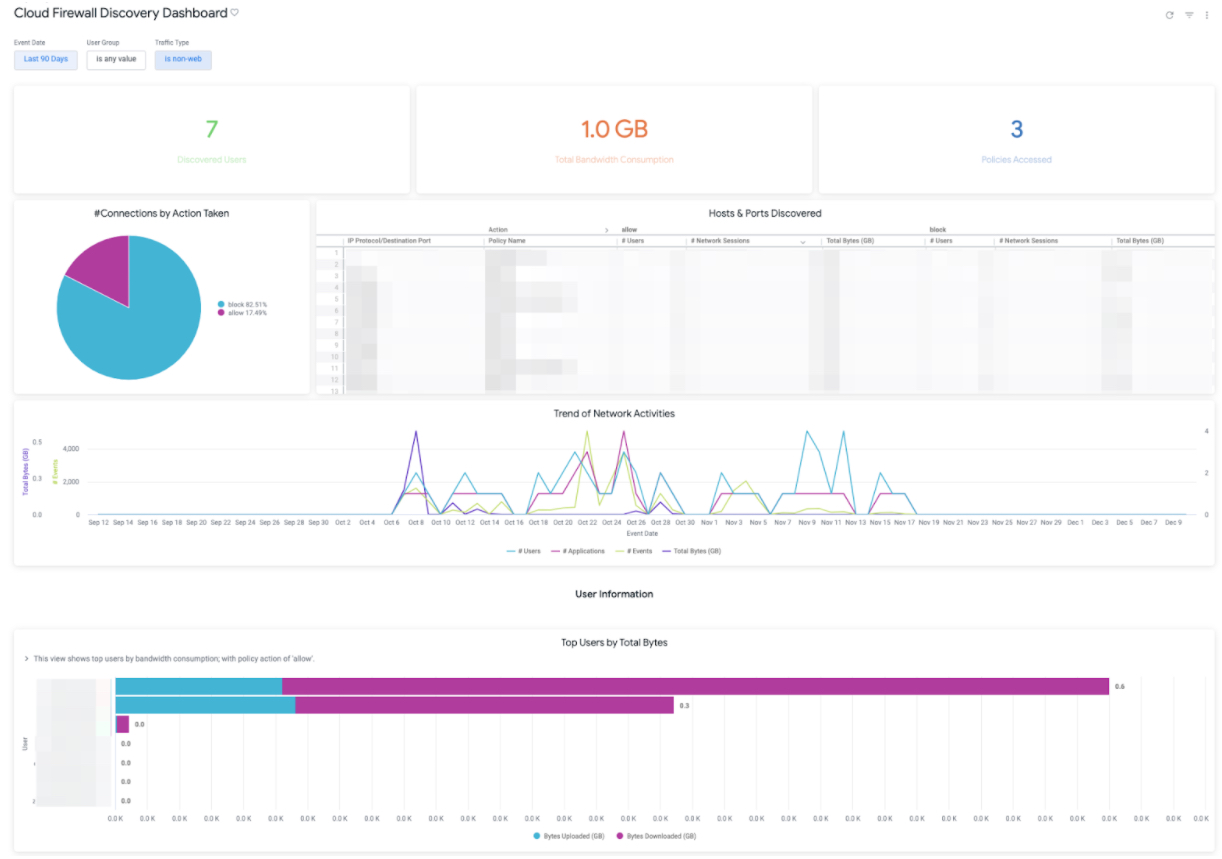
Use the Cloud Firewall Discovery Dashboard to get started reporting on Cloud Firewall Events. You can filter and sort this information and save the dashboard to your library.

The following table shows the default Cloud Firewall Discovery Dashboard default tiles.
Tile Name | Description |
|---|---|
Discovered Users | Total number of discovered users. |
Hosts & Ports Discovered | Cloud Firewall policy in use, with host and ports, number of users, number of connections, and total byte traffic. |
Policies Accessed | Total number of policies accessed. |
Top Blocked Services | Shows the blocked applications (IP Protocol, Destination Port, Destination IP). |
Top Users by Total Bytes | Shows the top users by bandwidth consumption, with the "Allow" policy action. |
Top Users/Source IP by Blocked Connections | Shows top users/source IP blocked by number of connections. |
Total Bandwidth Consumption | Traffic flow by total bytes (GB). |
Trend of Total Bandwidth Consumption by Top Users | Shows the top users by bandwidth consumption with the "Allow" policy action. |
Trend of Total Bandwidth Consumption by Top Business Units | Shows the top user groups by bandwidth consumption with the "Allow" policy action. |
Trend of Total Bandwidth Consumption by Traffic Direction | Shows the flow of byte traffic by policy (uploads and downloads). |
Trend of Network Activities | Shows the trend for the following network activities: users, events, and total bytes (GB). |
To learn more about dashboards: Netskope Library and Creating Reports (Dashboards)