Explore Page
The Explore page is your starting point to define the dimensions, measures, and other fields that are used in your report to retrieve, customize, and chart your data.
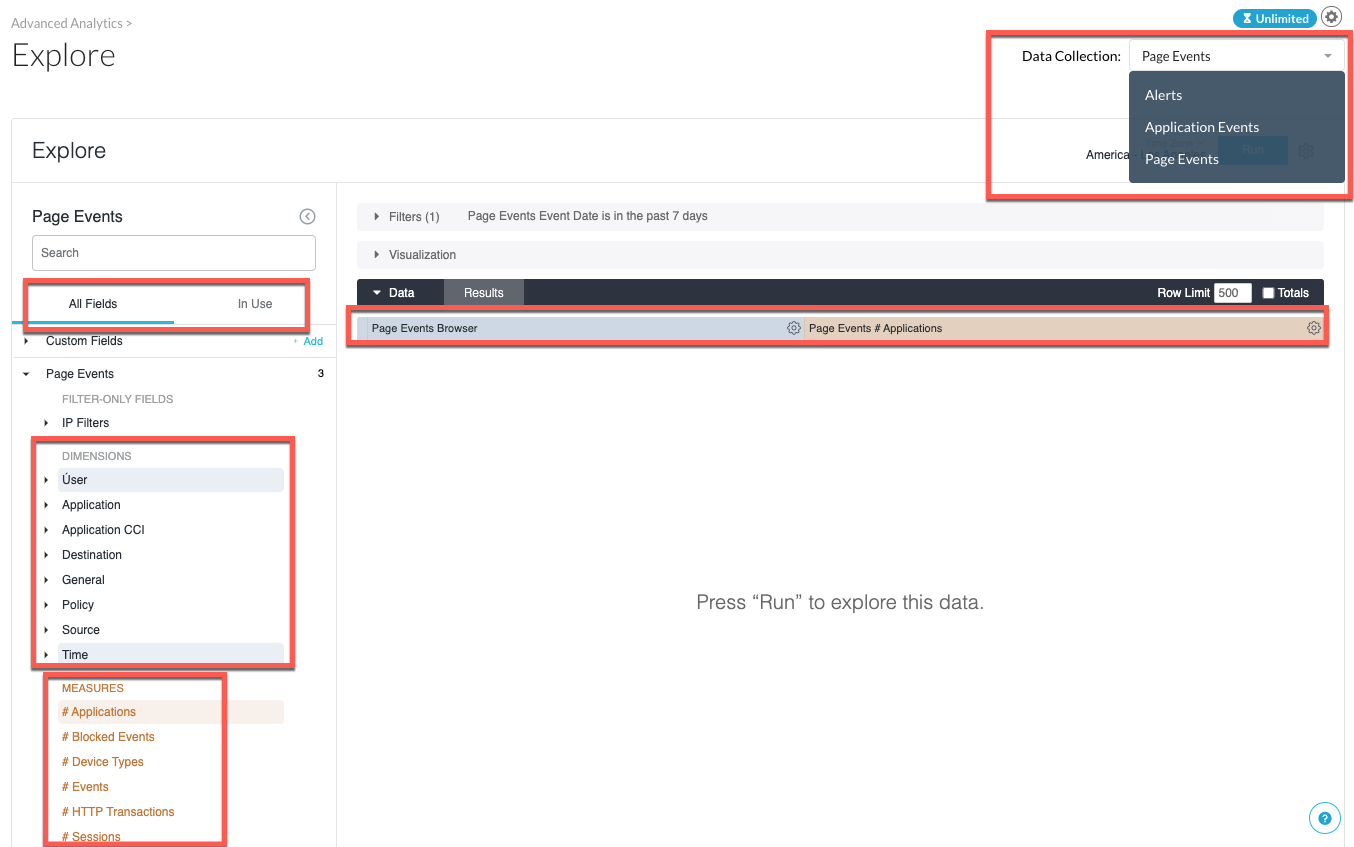
Netskope's Data Collection dropdown provides focused areas of interest by which to analyze data:
Note
The data collection available to you may vary depending on your Advanced Analytics license.
The data shown in an Explore is determined by the dimensions and measures you select from the All Fields and In Use options at the left. A dimension can be thought of as a group or bucket of data. A measure is information about that bucket of data. Dimensions appear as blue columns and measures appear as orange columns in your data table.

Retrieving Data
The following pages help you start building reports:
Exploring Data in Reports — Learn to build reports, display results, and discover insights.
Filtering and Limiting Data — Limit your results to the data you’re interested in.
Merging Results from Different Explores — Combine data from multiple reports.
Filter Expressions — Understand filter expression patterns.
Functions and Operators — Review the functions and operators used in expressions.
Adding Custom Formatting to Numeric Fields — Apply Excel-style formatting to numeric data in reports and charts.
Customizing Data
The following pages help you customize your reports:
Using Table Calculations — Create new fields by performing calculations on the results of your report.
Adding Custom Fields — Add custom dimensions and measures that become new field picker choices.
Creating Expressions — Perform custom calculations using expressions.
Functions and Operators — Get an overview of functions and operators used in expressions.
Charting Data
The following pages help you start visualizing your data:
Creating Visualizations and Graphs — Create visualizations and graphs based on the results of your reports.
Visualization Types — Learn about native visualization types.